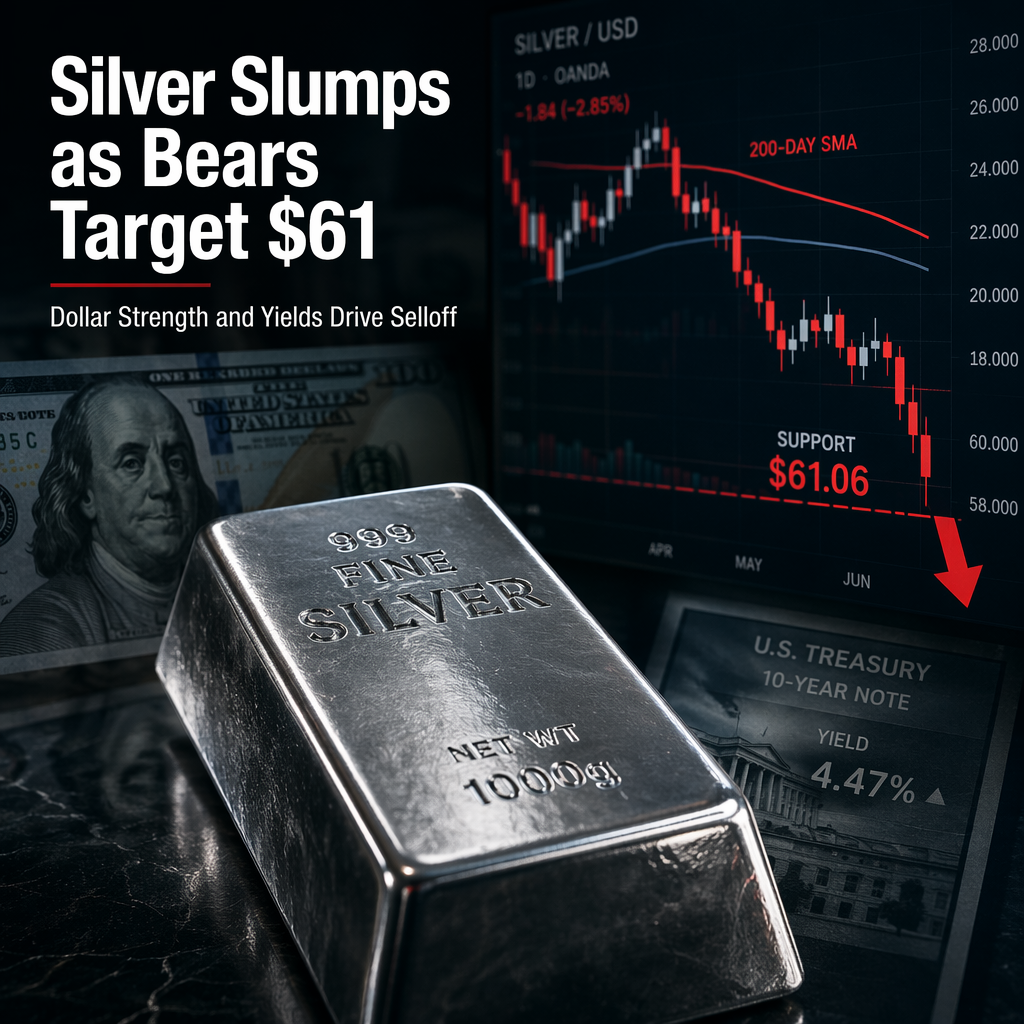
Silver (XAG/USD) experienced a significant decline, dropping for the third consecutive trading day and falling over 3.32% on Friday. This downward movement was attributed to broad US Dollar strength and rising US Treasury yields, which have been increasing since Wednesday following the Federal Reserve's hawkish stance [1]. The price of silver broke below the 200-day Simple Moving Average (SMA) at $69.11, a level that had been tested three times during the week. However, buyers were unable to maintain support, allowing sellers to push the price below $65.00 [1].
Technical indicators suggest that bearish momentum remains, as reflected by the Relative Strength Index (RSI), though there are signs that selling pressure may be easing somewhat [1]. For the bearish trend to continue, silver would need to break the March 23 daily low of $61.06. If this level is breached, the next support levels are identified at $60.00, followed by the November 13, 2025, daily high-turned-support at $54.39, and then the $50.00 mark [1]. Conversely, for silver to resume its uptrend, buyers would need to reclaim the 200-day SMA at $69.11, with further resistance at $70.00 and the 50-day SMA at $74.88 [1].
The article notes that silver prices are influenced by several factors, including US Dollar movements, interest rates, and industrial demand, particularly from sectors such as electronics and solar energy. The current decline is primarily linked to the stronger US Dollar and higher yields, which typically weigh on yieldless assets like silver [1].
No specific analyst opinions or forward-looking statements beyond the technical outlook were provided in the article.
CONCLUSION
Silver's recent slide below the 200-day SMA and the 3.32% drop reflect ongoing bearish sentiment driven by a strong US Dollar and rising Treasury yields. Key technical levels to watch include support at $61.06 and resistance at $69.11. The market remains cautious, with further declines possible if bearish momentum persists.