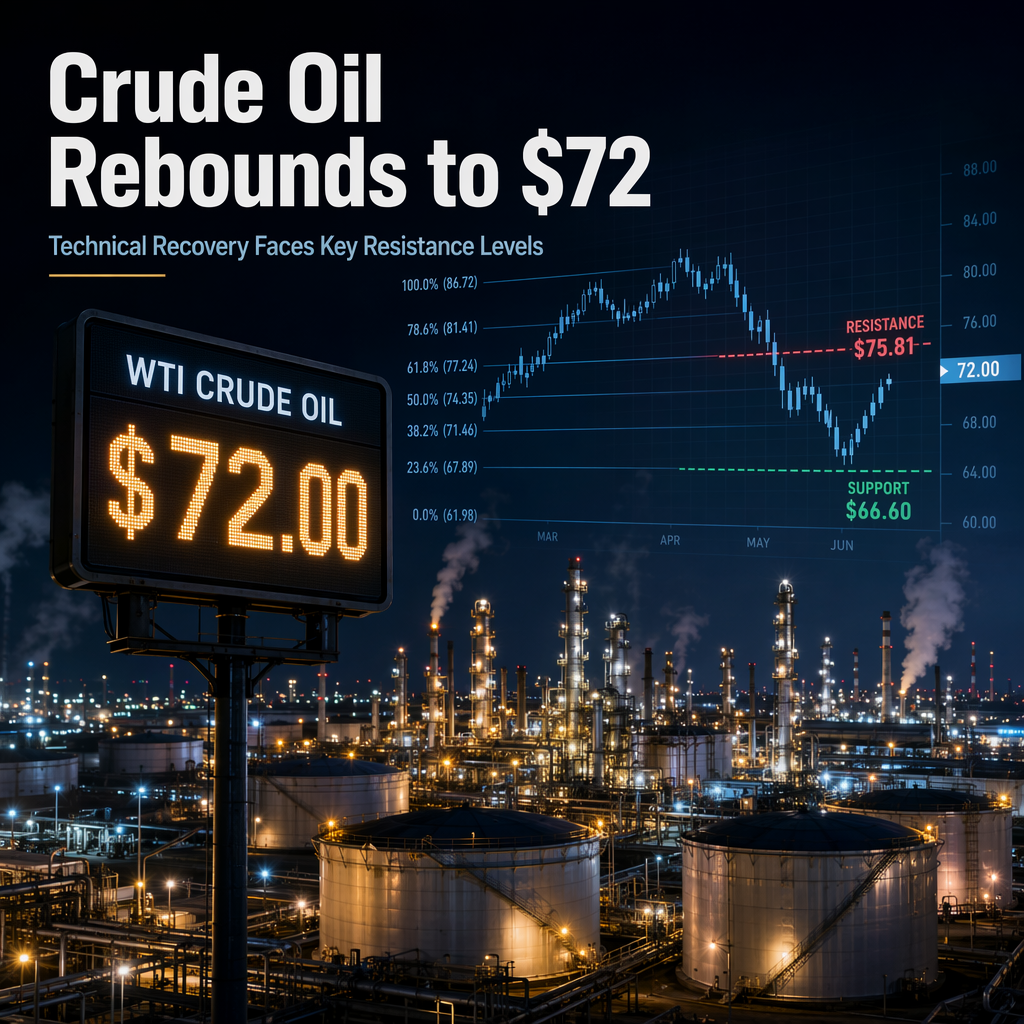
West Texas Intermediate (WTI), the benchmark US crude oil price, edged higher during the Asian session on Friday, recovering from the previous day's retracement slide and reclaiming the $72.00 mark. This move positions WTI to register weekly gains for the first time in the past five weeks, following a recent recovery from its lowest level since February, which was touched last week [1].
From a technical perspective, the recovery faltered near the 23.6% Fibonacci retracement level of the May-July decline earlier this week, and WTI remains below the 200-day Exponential Moving Average (EMA), maintaining a bearish near-term tone amid mixed momentum indicators. The Moving Average Convergence Divergence (MACD) has turned positive and is advancing above its signal line, suggesting an ongoing corrective bounce. However, the Relative Strength Index (RSI) at around 41 indicates weak demand, implying that rallies could remain capped while prices trade below the 23.6% Fibo. and the 200-day EMA [1].
Key resistance levels for WTI are identified at the 23.6% Fibo. level at $75.81, the 200-day EMA at approximately $77.18, the 38.2% retracement near $81.50, and the 50% level around $86.11. On the downside, primary structural support is at the recent cycle low of $66.60, where a break could lead to deeper bearish extension despite the currently improving technical backdrop [1].
No specific market reactions or analyst opinions are mentioned in the article, and there are no forward-looking statements regarding future price movements beyond the technical analysis provided [1].
CONCLUSION
WTI crude oil has rebounded to $72.00, signaling a potential end to its recent losing streak, but faces significant resistance at key technical levels. The market tone remains cautiously optimistic, with technical indicators suggesting limited upside unless prices break above the 23.6% Fibonacci retracement and 200-day EMA. Investors should monitor these levels for further direction, as a break below $66.60 could trigger deeper declines.