Portfolio Analyst
The Portfolio Analyst provides deep insights into your portfolio performance, asset allocation, diversification, and historical returns with interactive visualizations.
What It Does
The Portfolio Analyst connects to your live account data to analyze performance, allocation, win rate, equity curves, and provide rebalancing recommendations — all visualized with interactive charts.
Step 1: Select the Portfolio Analyst
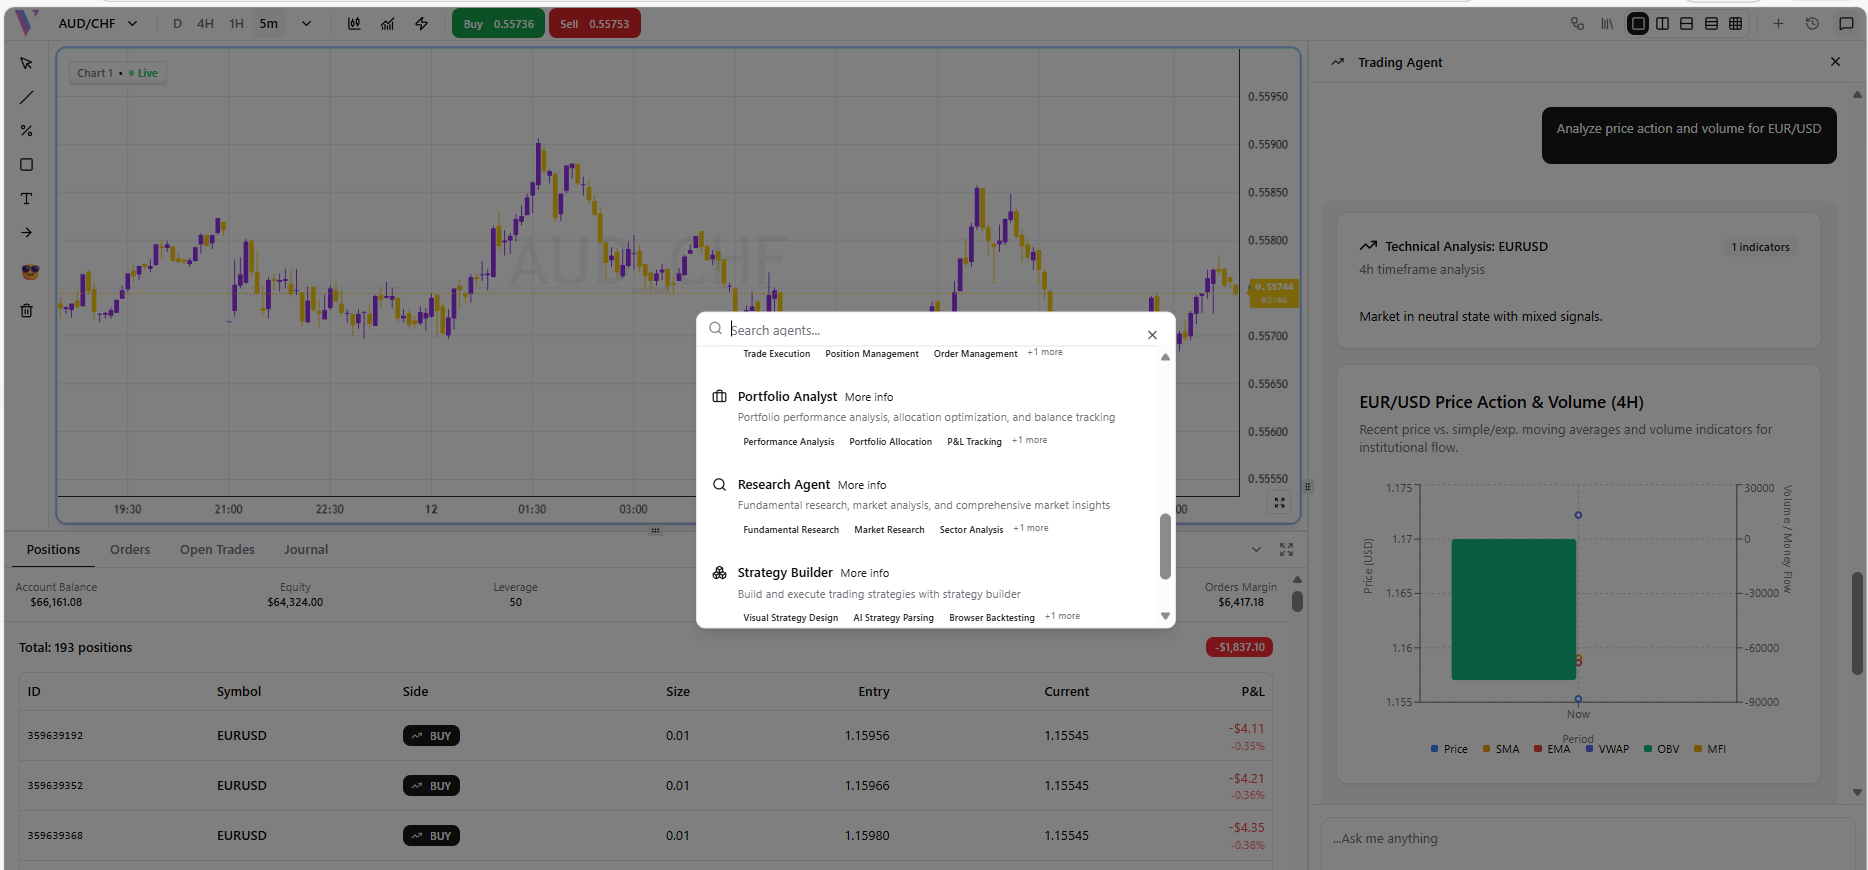
Click the **Brain icon** in the bottom-right of the chat to open the Agent Selector, then choose **Portfolio Analyst**.
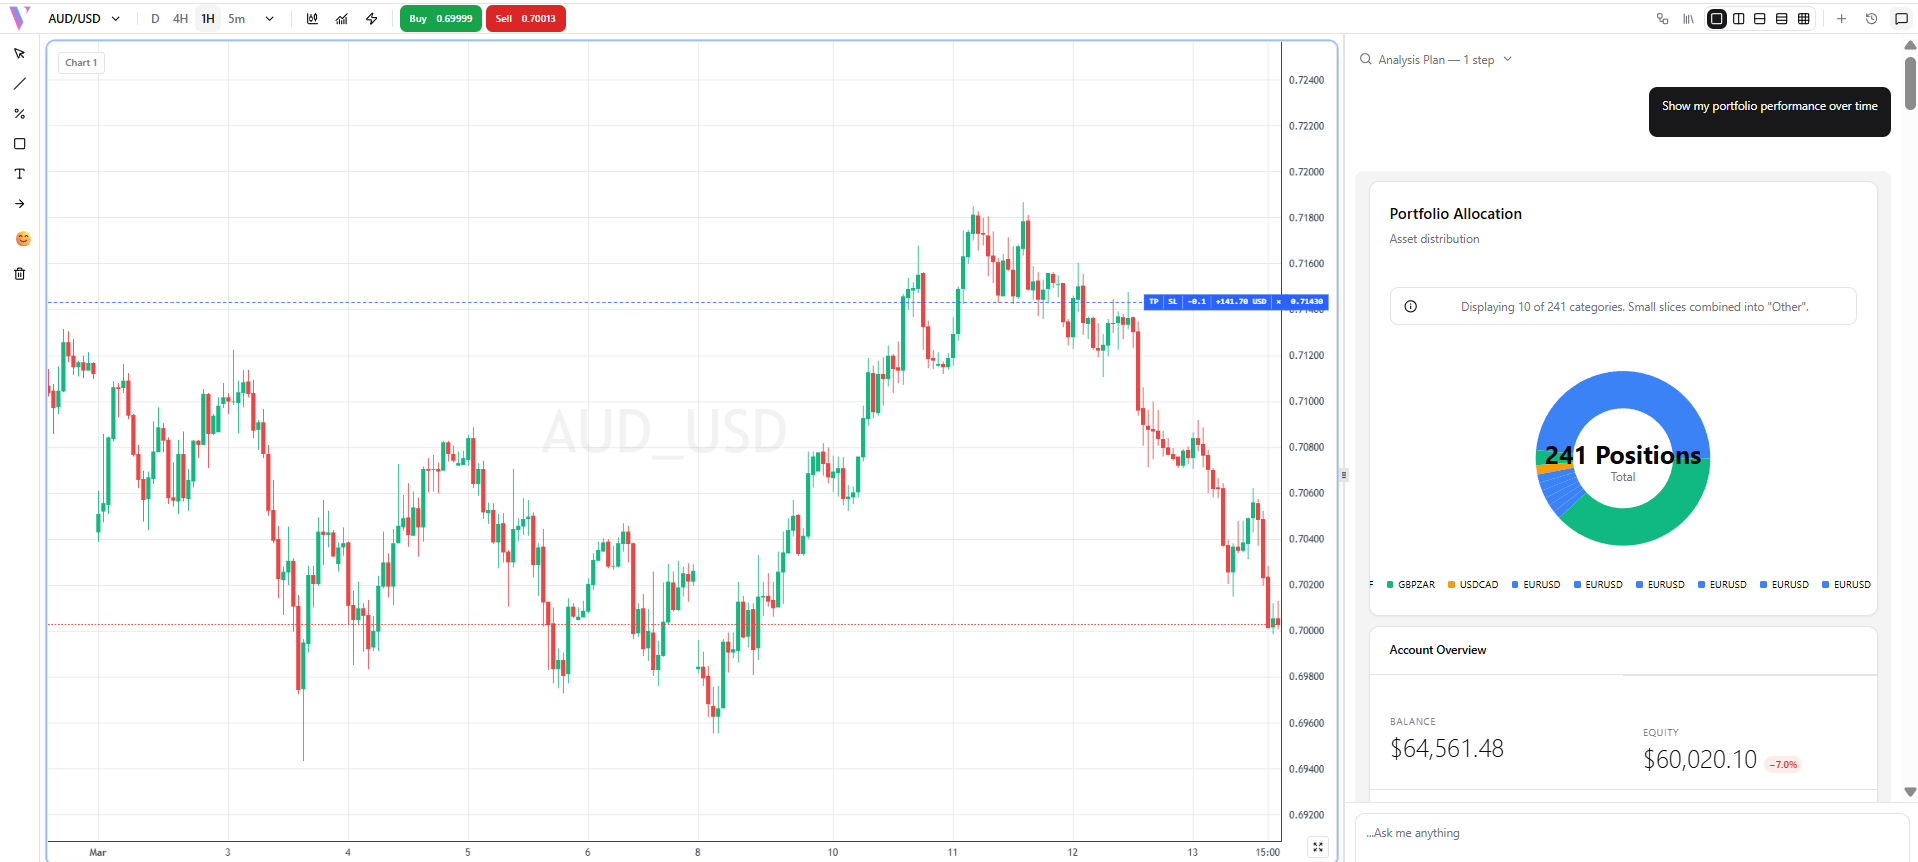
Example 1: Account Overview
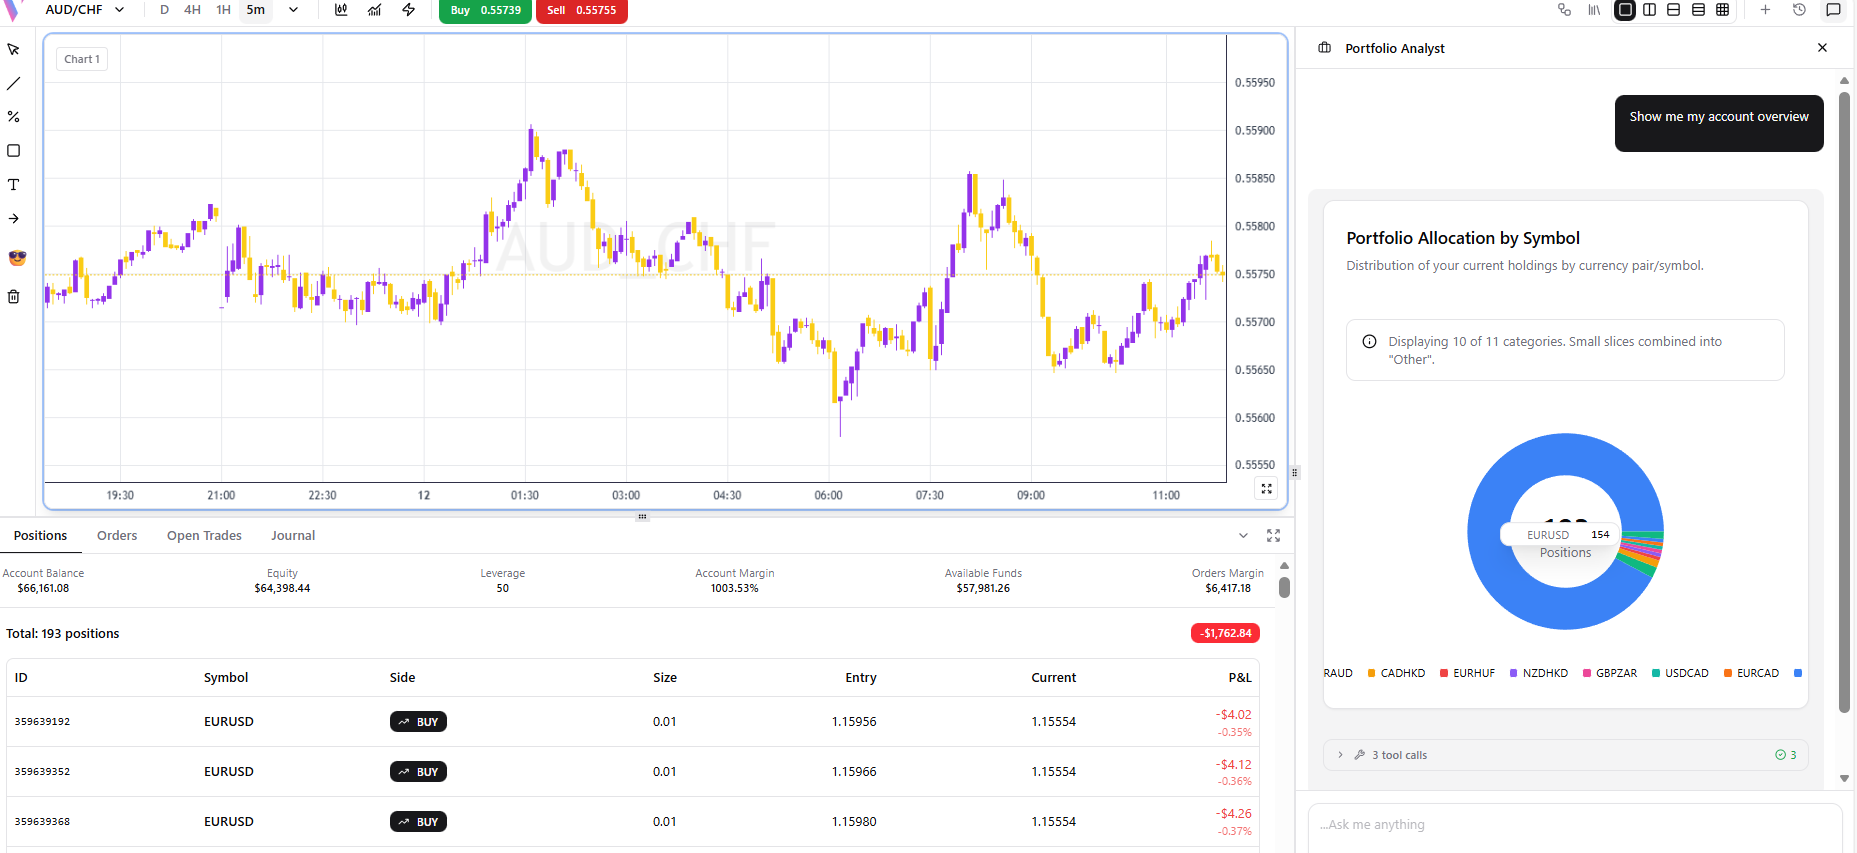
**Prompt:** "Show me my account overview" **What You Get:** A complete account snapshot with balance, equity, and margin.
Example 2: Position Status
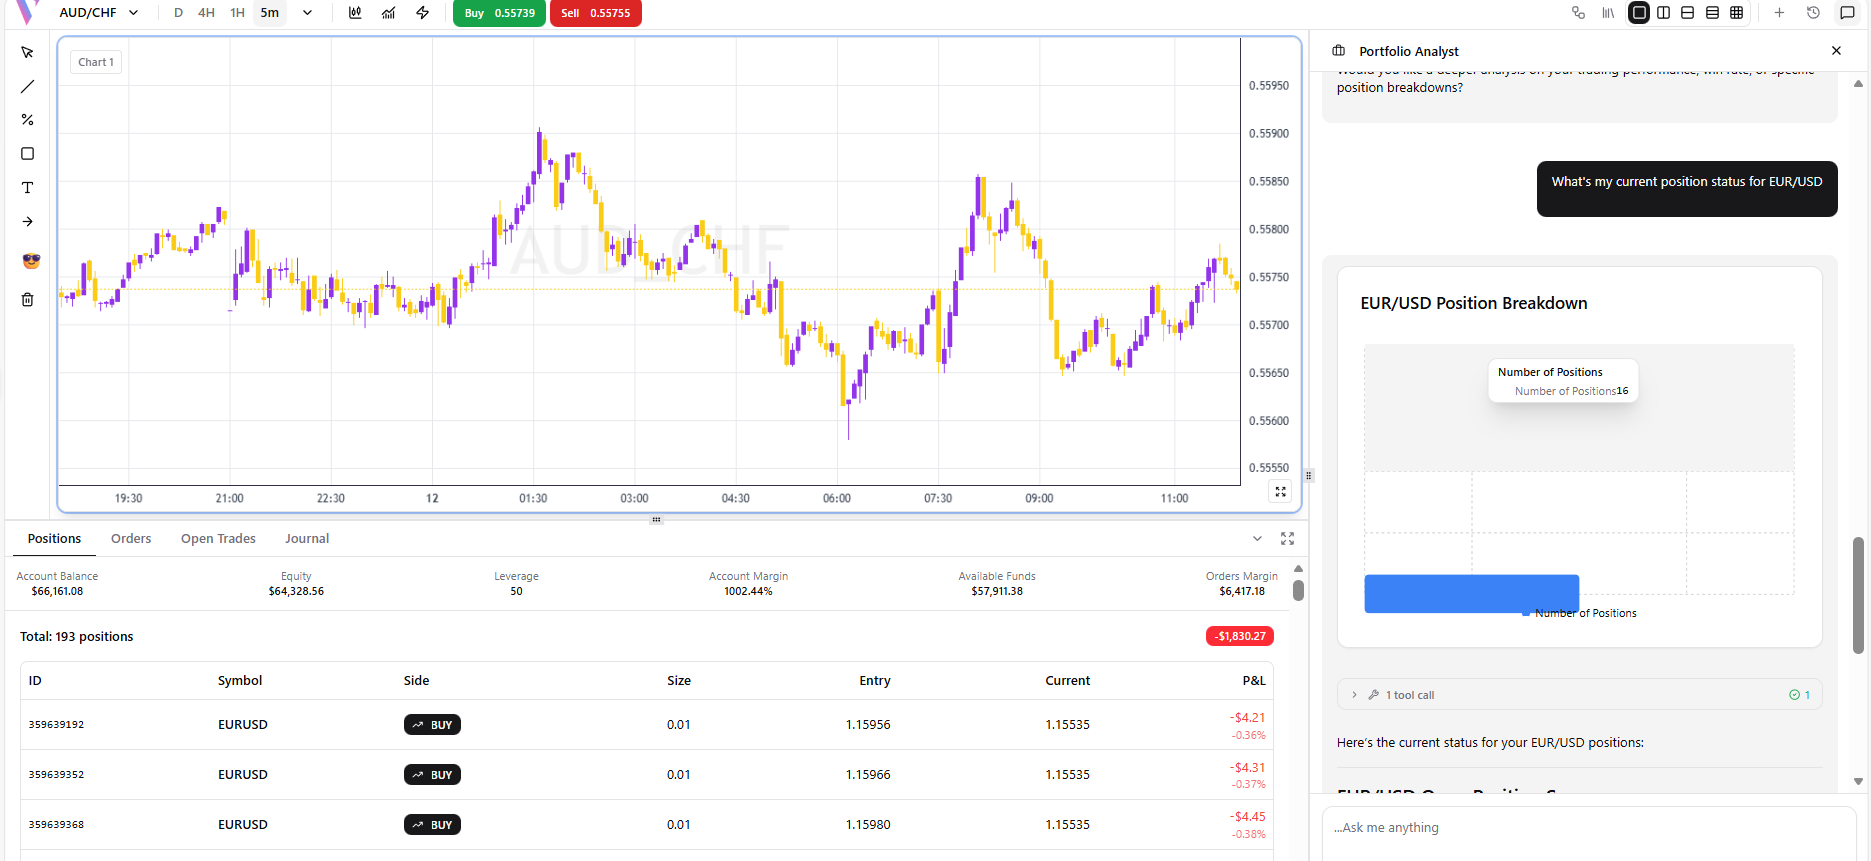
**Prompt:** "What's my current position status for EUR/USD" **What You Get:** Detailed P&L, lot size, and entry price for that specific position.
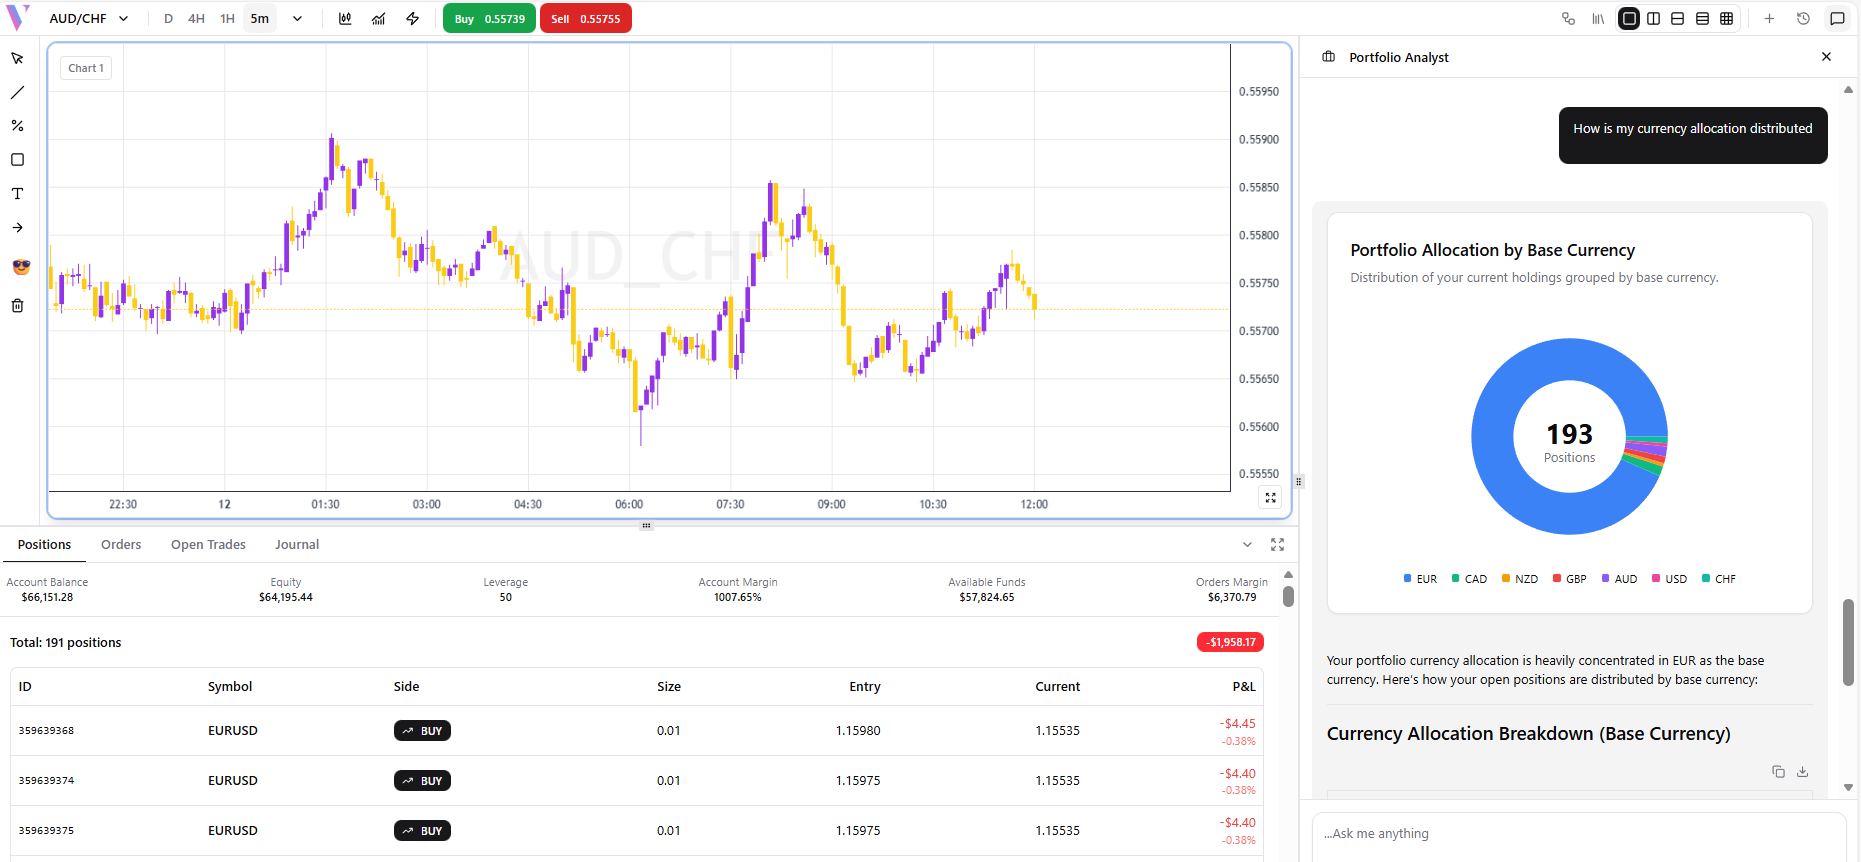
Example 3: Currency Allocation
**Prompt:** "How is my currency allocation distributed" **What You Get:** A pie chart showing percentage allocation by currency pair.
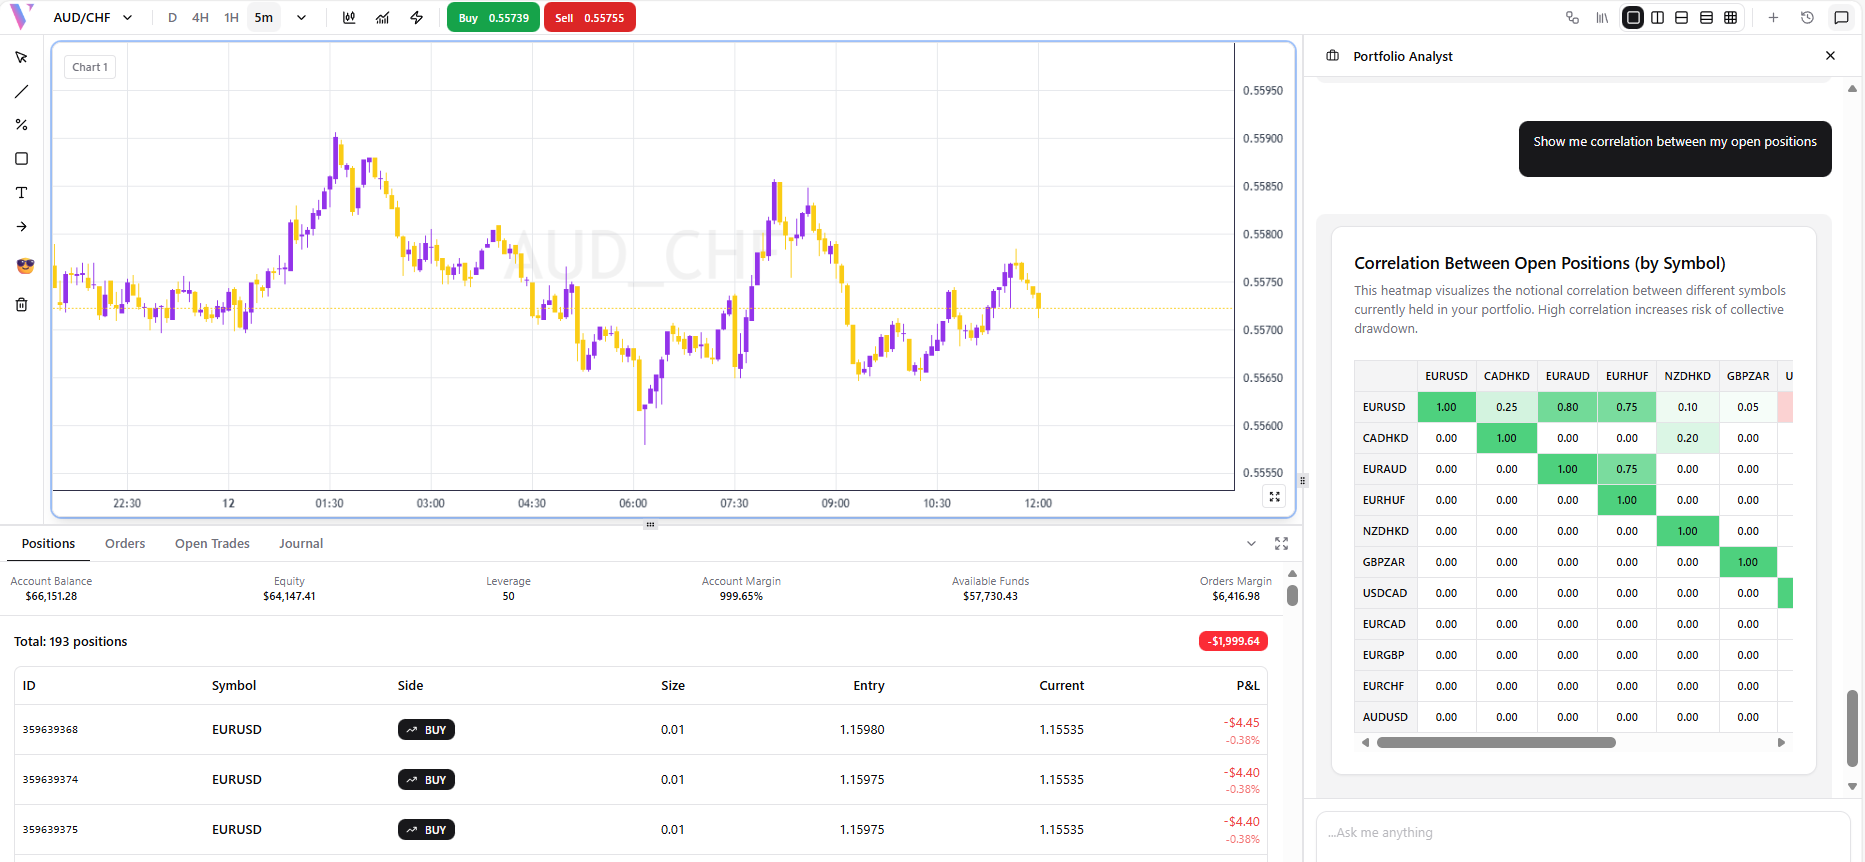
Example 4: Position Correlation
**Prompt:** "Show me correlation between my open positions" **What You Get:** A correlation matrix/chart between your active trades.
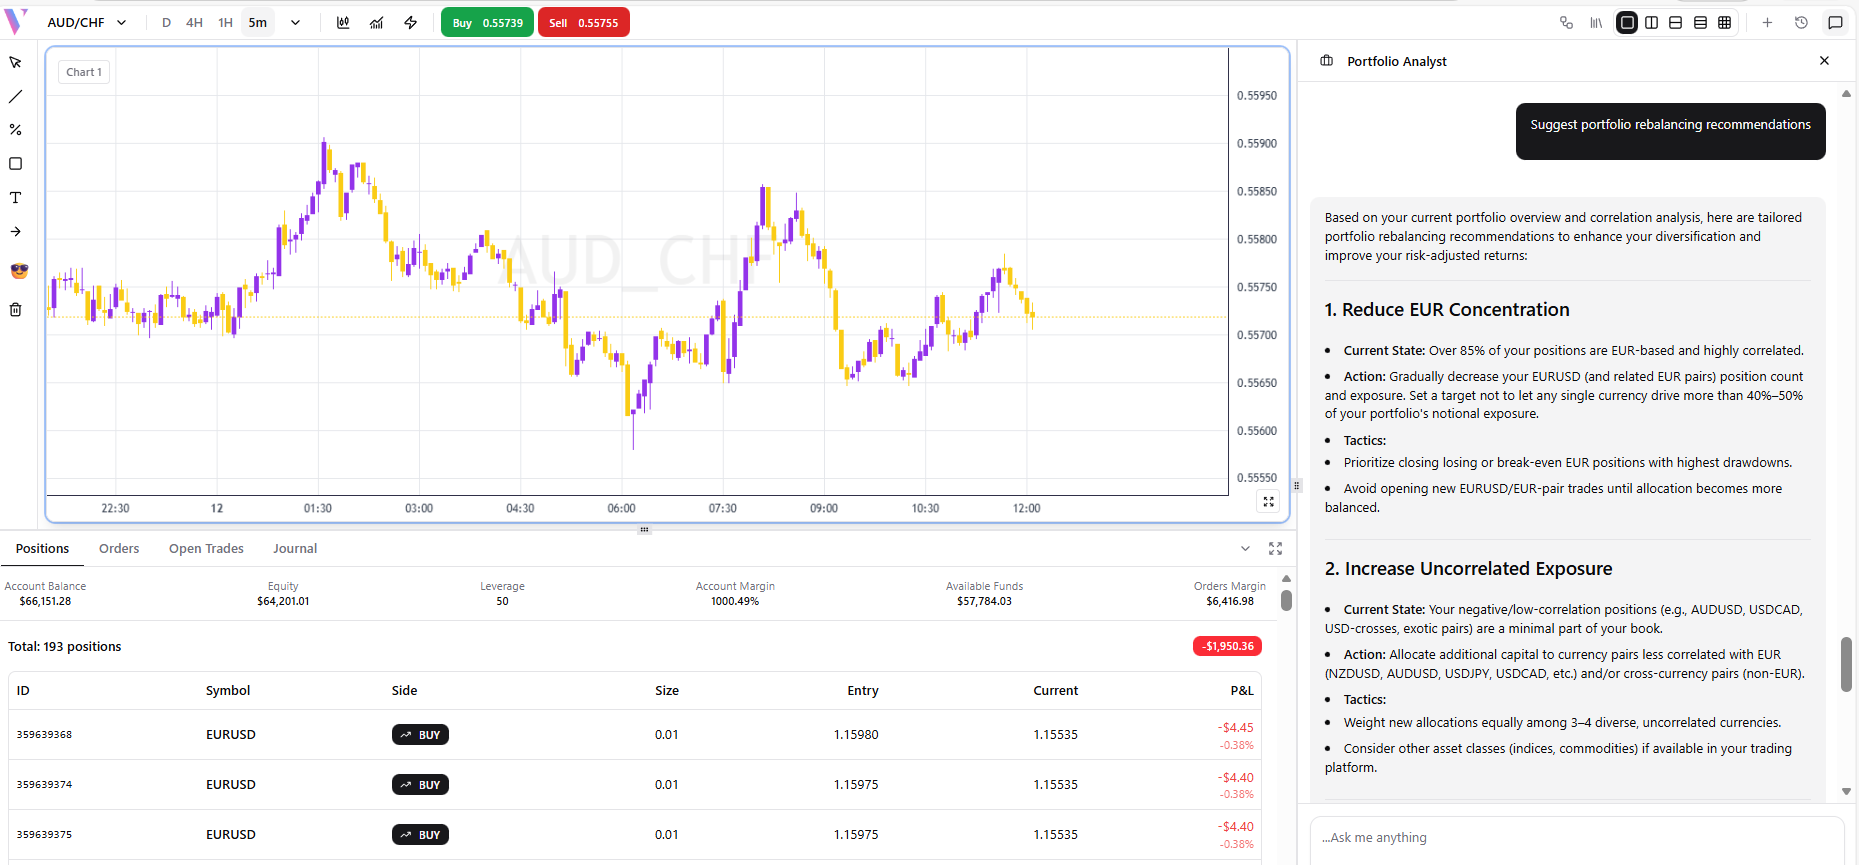
Example 5: Rebalancing Recommendations
**Prompt:** "Suggest portfolio rebalancing recommendations based on my trades" **What You Get:** AI-generated rebalancing suggestions with reasoning.
Example 6: Performance Over Time
**Prompt:** "Show my portfolio performance over time" **What You Get:** An equity curve line chart tracking your account growth.
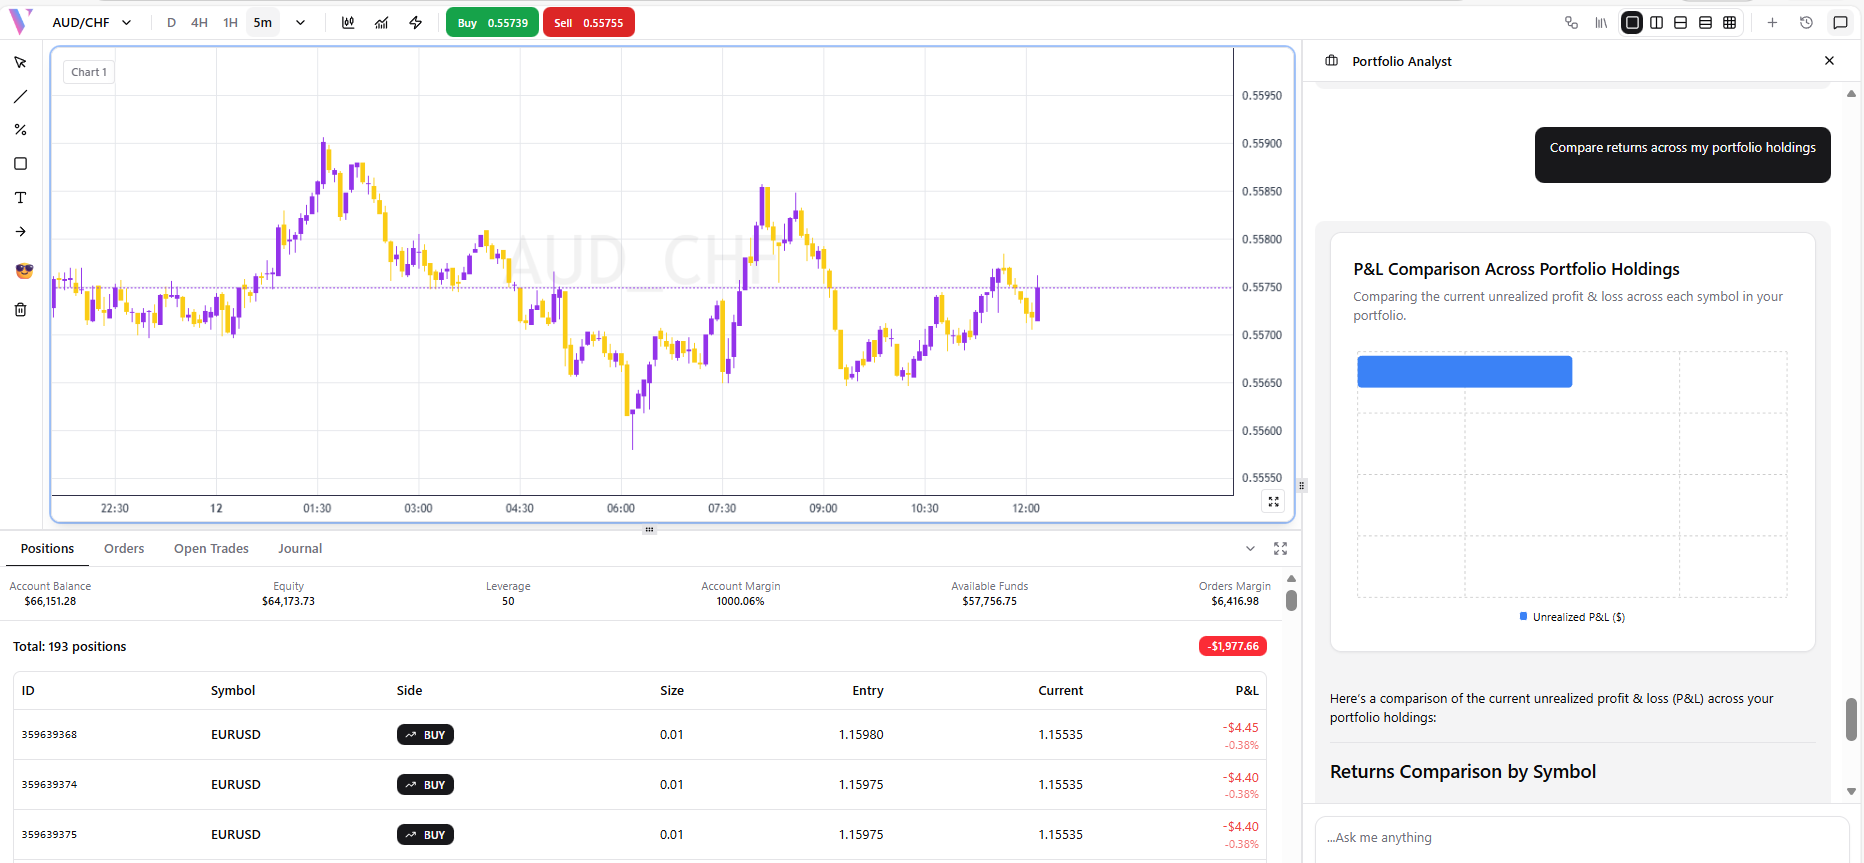
Example 7: Compare Returns
**Prompt:** "Compare returns across my portfolio holdings" **What You Get:** A bar/line comparison of returns per instrument.
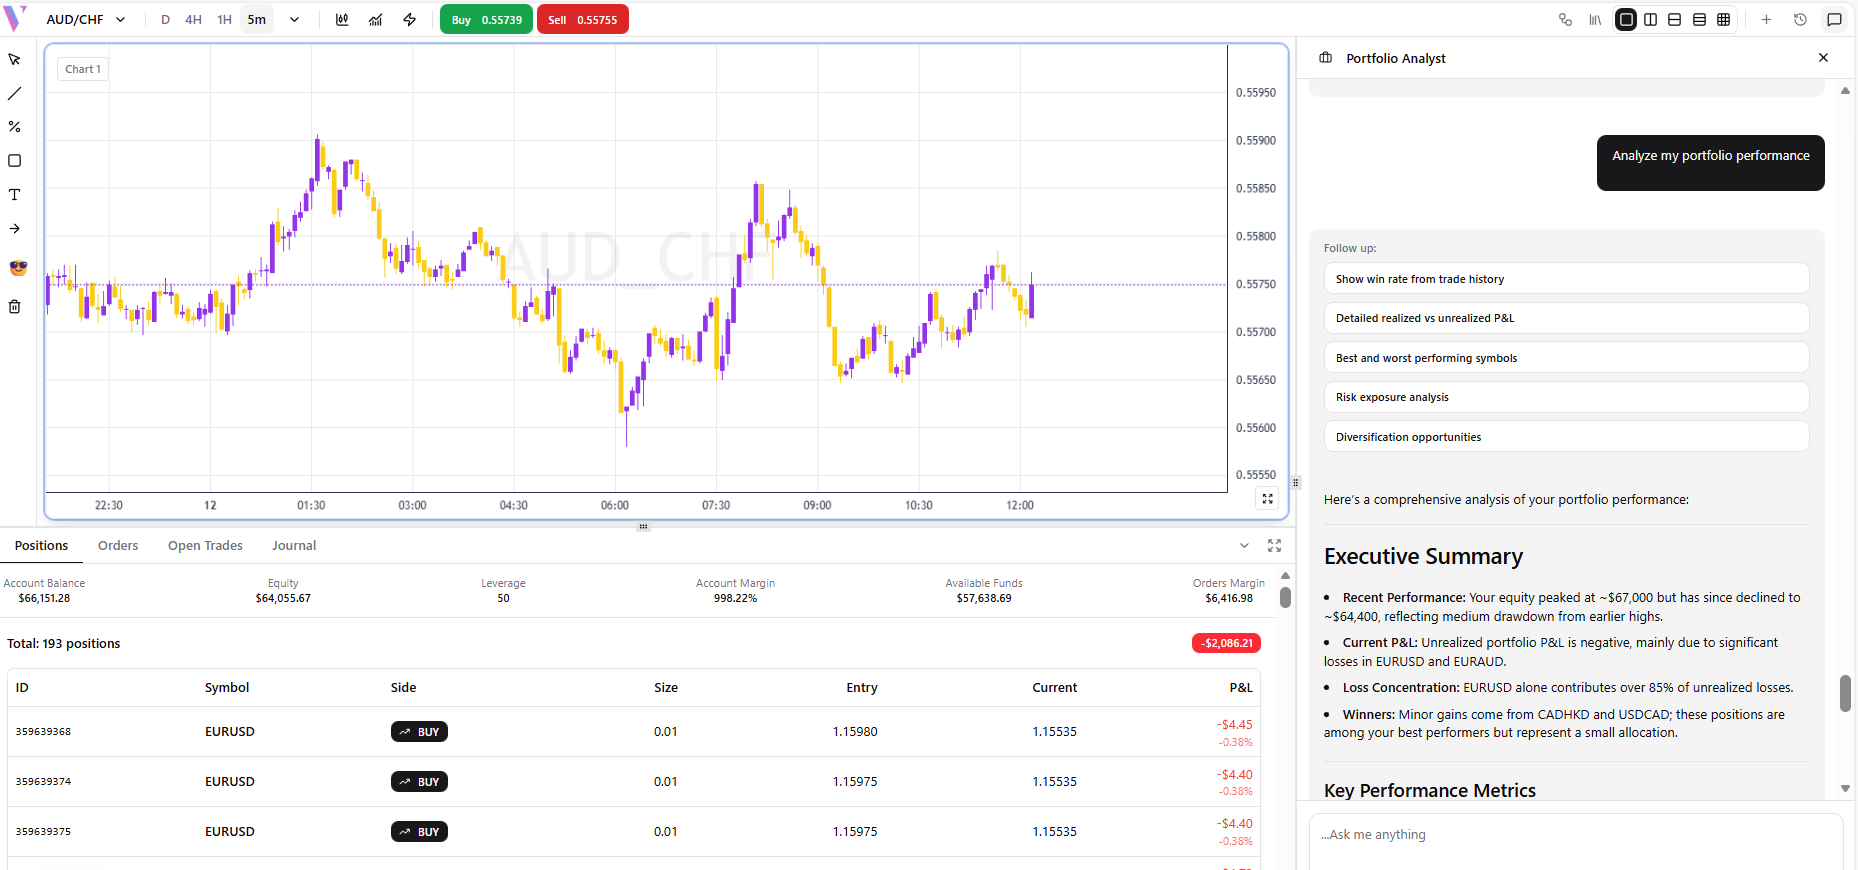
Example 8: Full Performance Report
**Prompt:** "Analyze my portfolio performance" **What You Get:** A full performance report with win rate, profit factor, and Sharpe ratio.
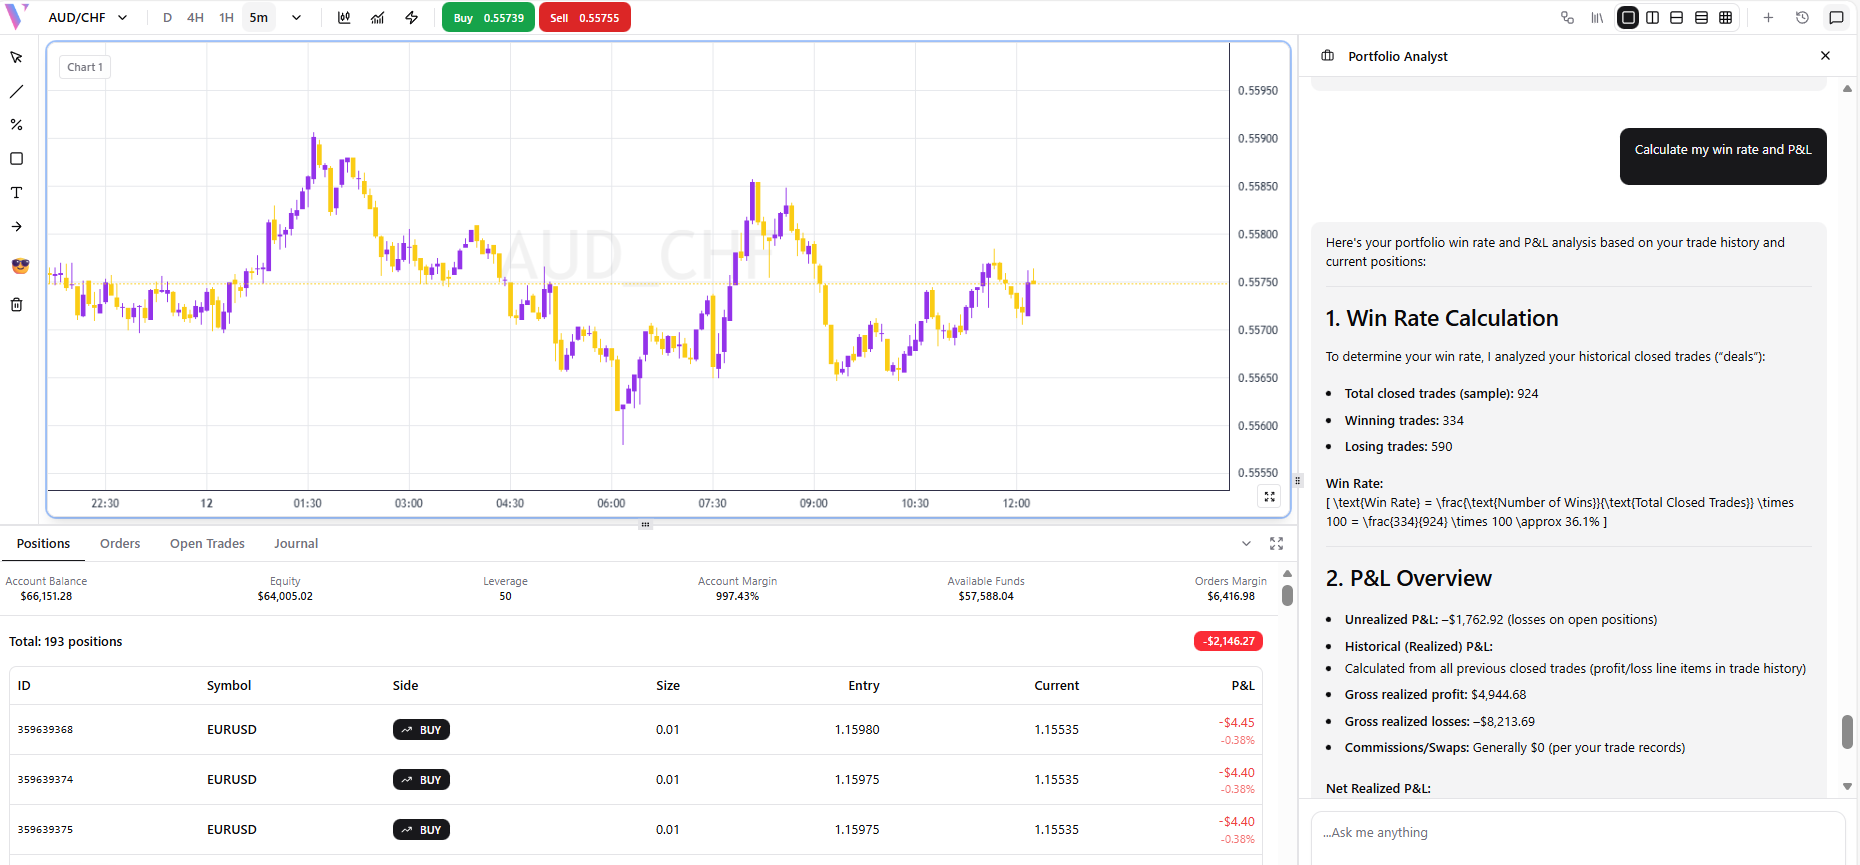
Example 9: Win Rate & P&L
**Prompt:** "Calculate my win rate and P&L" **What You Get:** Win/loss statistics with total realized P&L.
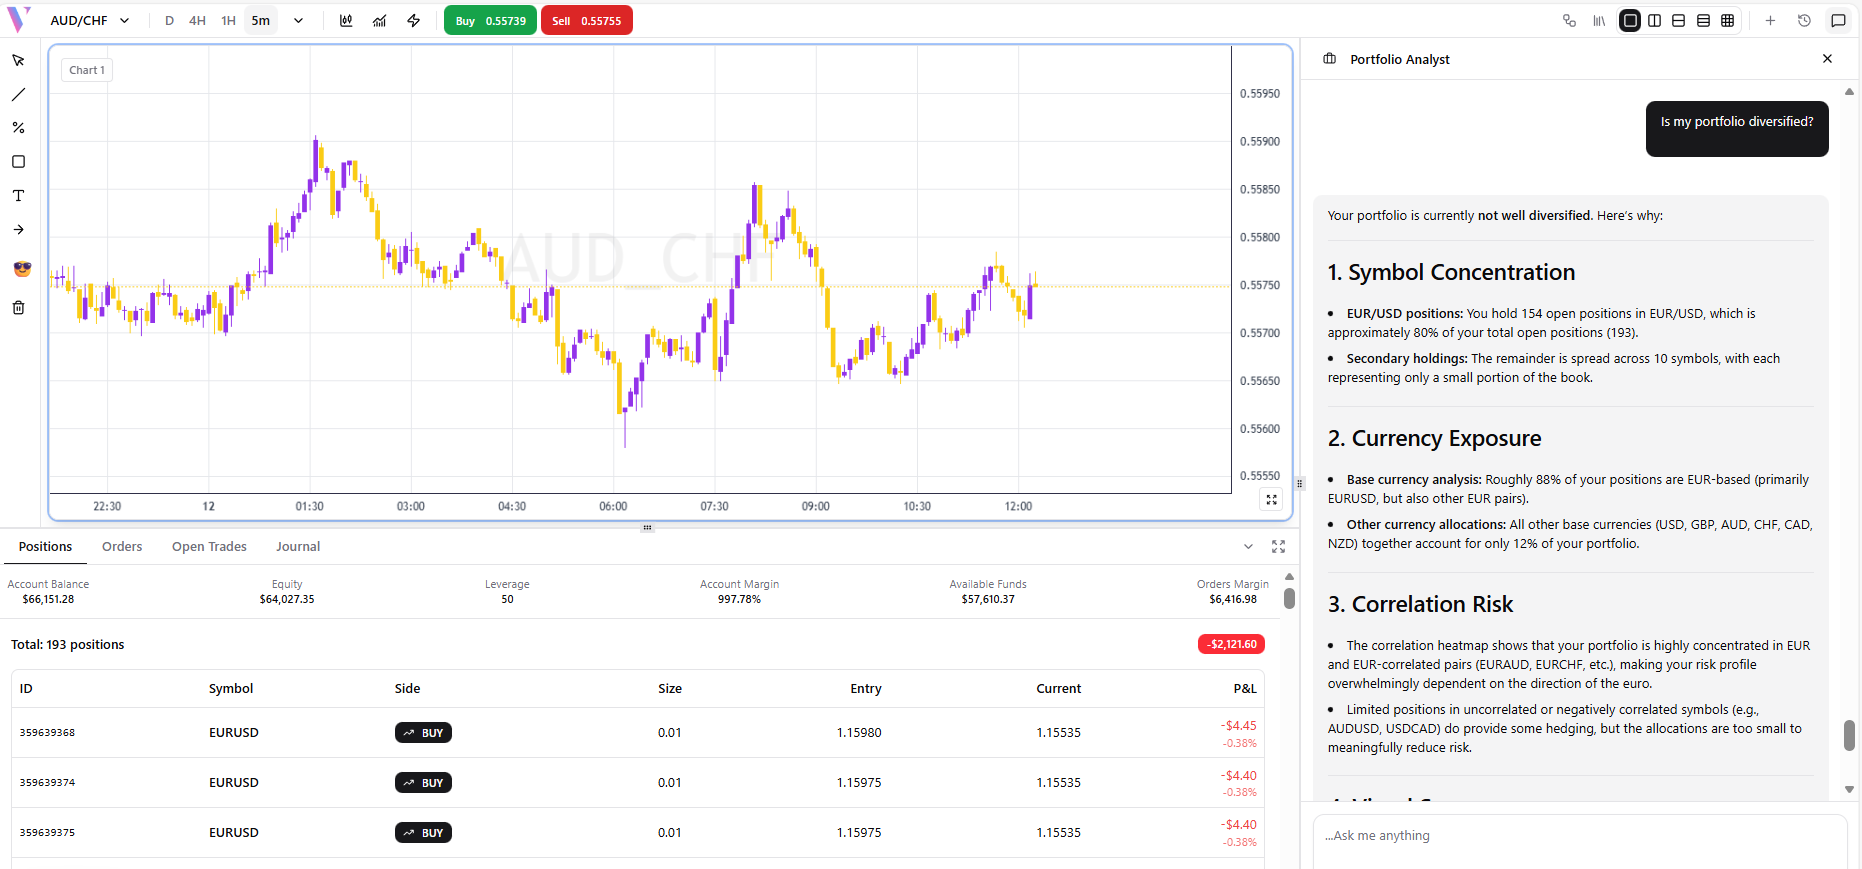
Example 10: Diversification Check
**Prompt:** "Is my portfolio diversified?" **What You Get:** A diversification assessment with concentration risk scores.