Skip to Content
Back to Showcase
Fibonacci Analysis
Use Fibonacci retracement levels to identify key support and resistance zones for optimal trade entries.
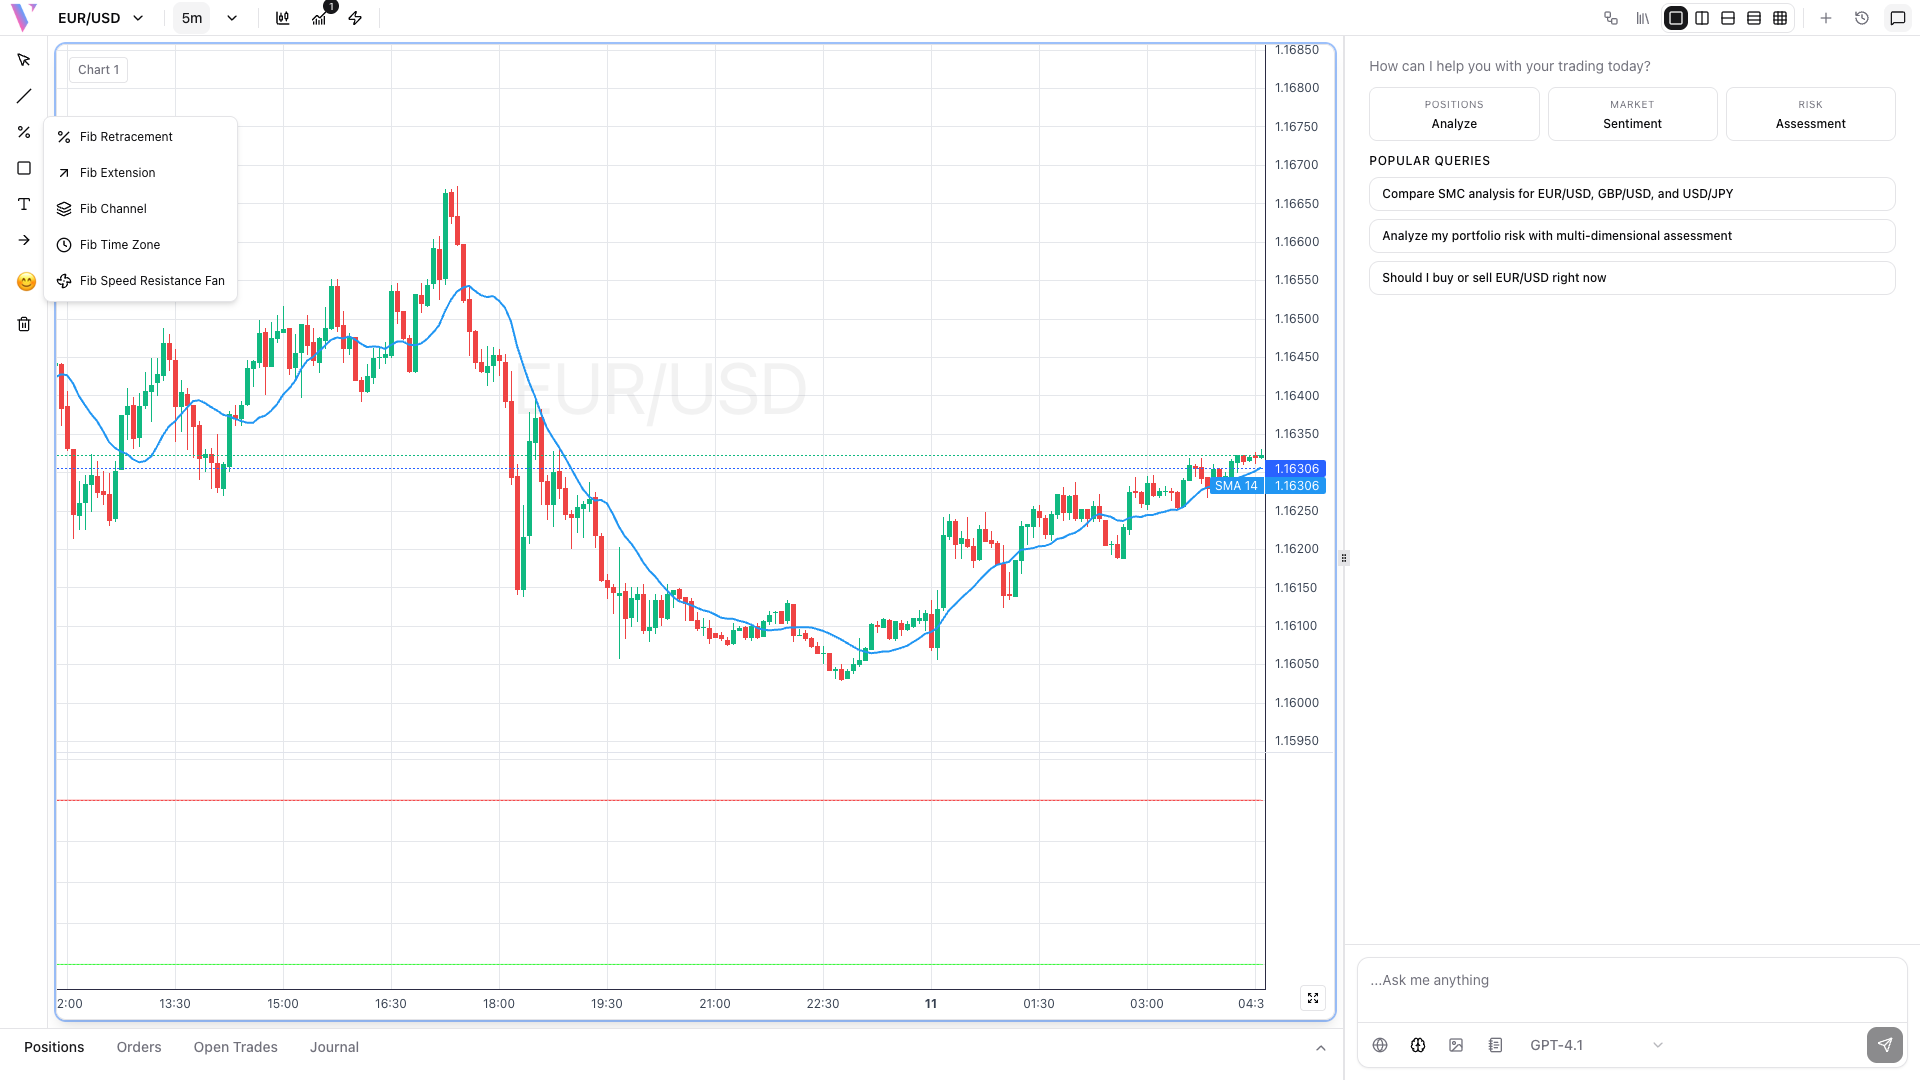
Step 1 /
Select Fibonacci Tool
Click the Fib Retracement button in the drawing toolbar to access Fibonacci tools including retracements, extensions, and channels.
Step 2 /
Draw from Swing Points
Click and drag from a significant swing low to swing high (uptrend) or high to low (downtrend) to plot Fibonacci levels.
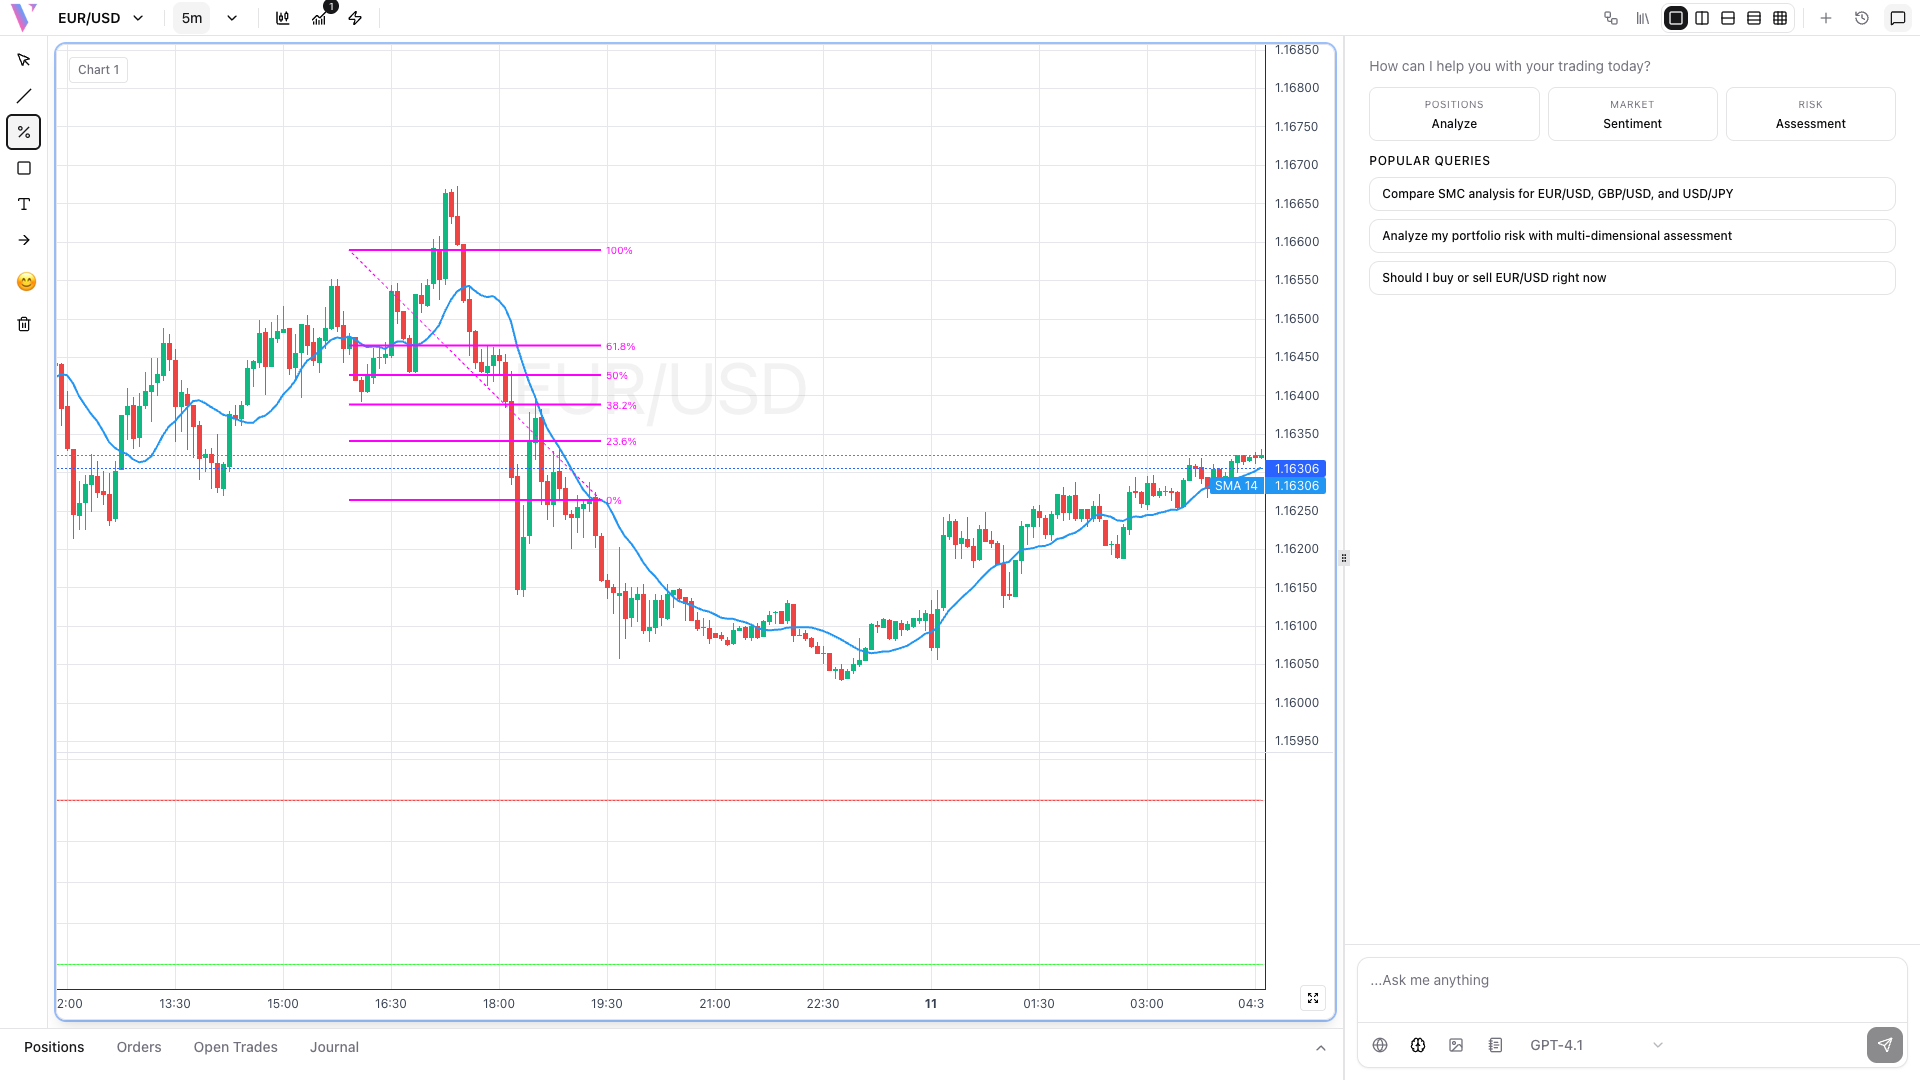
Step 3 /
Identify Key Levels
Monitor price action at crucial Fibonacci levels: 23.6%, 38.2%, 50%, 61.8%, and 78.6% for potential reversals or continuations.
Step 4 /
Plan Your Trades
Place limit orders at key Fibonacci levels with stop losses beyond the next level. The 61.8% level often provides strong support/resistance.