How to View Charts
Switch between Candlestick, Line, and Area chart styles to match your trading style and analysis needs.
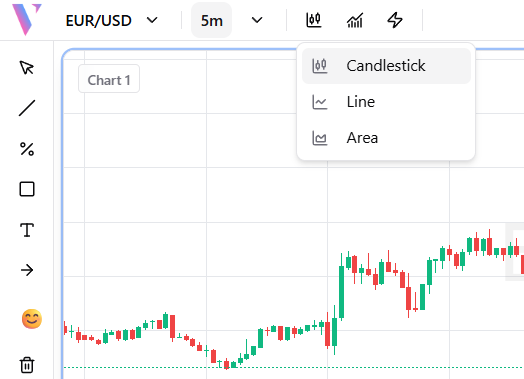
Open the Chart Type Selector
In the chart toolbar at the top, click the chart type icon (the first icon after the timeframe selector). A dropdown menu will appear showing all available chart view options: Candlestick, Line, and Area.
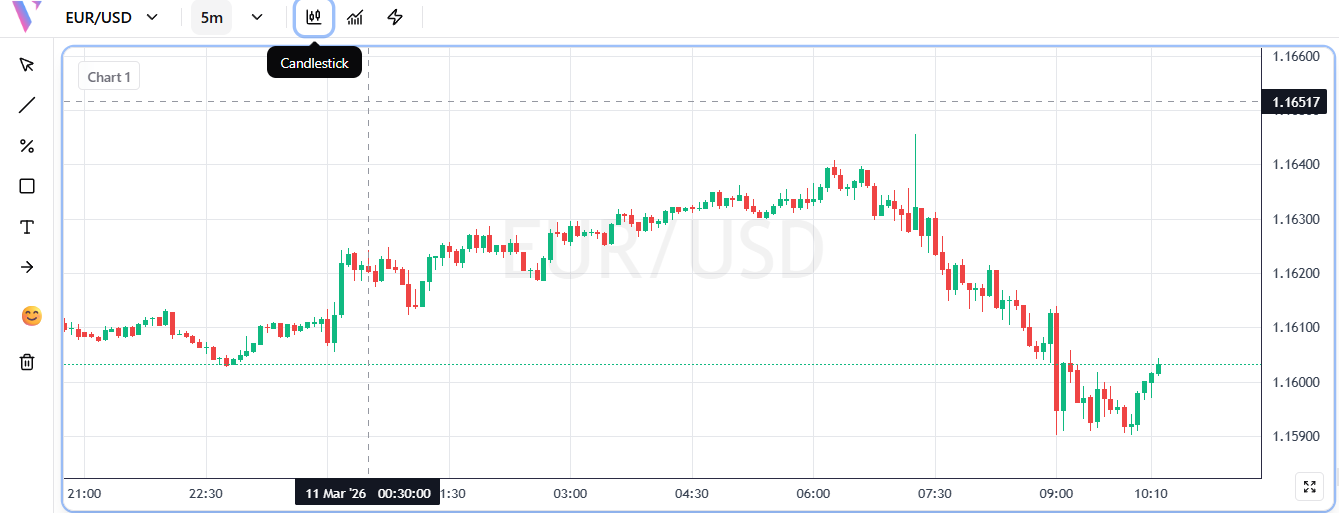
Candlestick View
Select 'Candlestick' to display OHLC (Open, High, Low, Close) data as Japanese candlesticks. Green candles indicate price closed higher than it opened; red candles indicate price closed lower. This is the most popular view for technical analysis, giving you the full picture of price action for each time period.
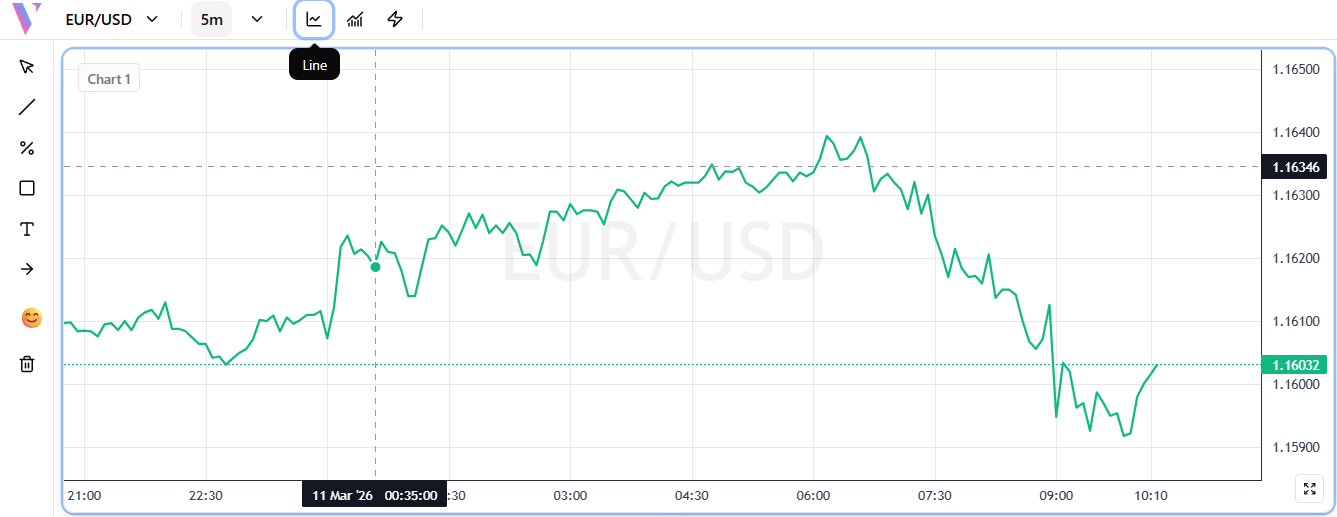
Line View
Select 'Line' for a clean, simplified view that connects only the closing price of each period with a continuous green line. This removes the noise of wicks and bodies, making it ideal for identifying overall price trends and key support or resistance levels at a glance.
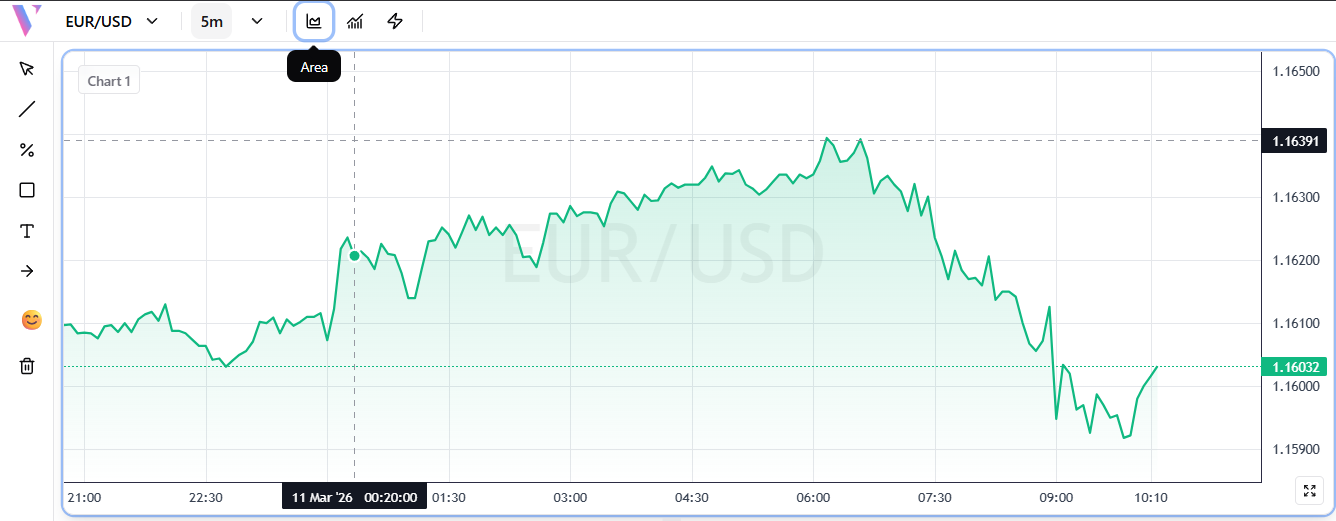
Area View
Select 'Area' to display the chart as a filled area chart. Similar to the Line view, it plots the closing price, but fills the area beneath the line with a semi-transparent gradient. This gives a strong visual impression of price momentum and is great for spotting bullish or bearish trends quickly.