Trading Journal
VibeTrader’s professional journal features a customizable widget system, detailed trade analytics, and a visual calendar to help you master your trading performance.
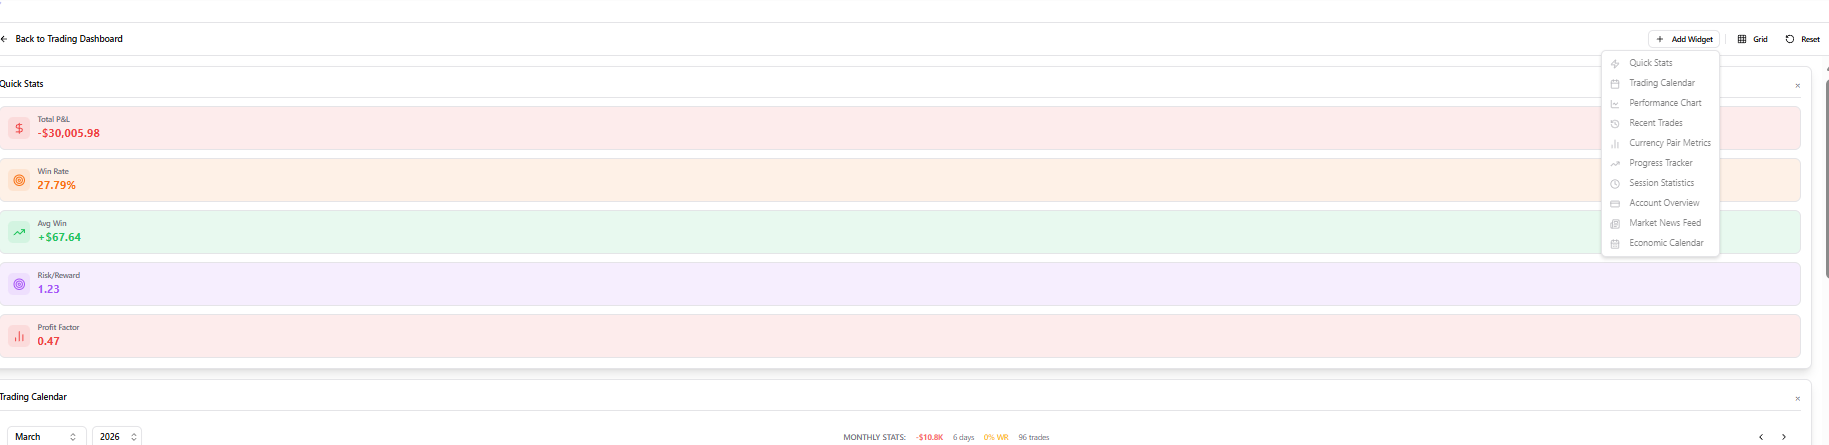
Performance Dashboard
Start with the overview dashboard showing Net PnL, Profit Factors, and Equity Curves across customizable widgets.
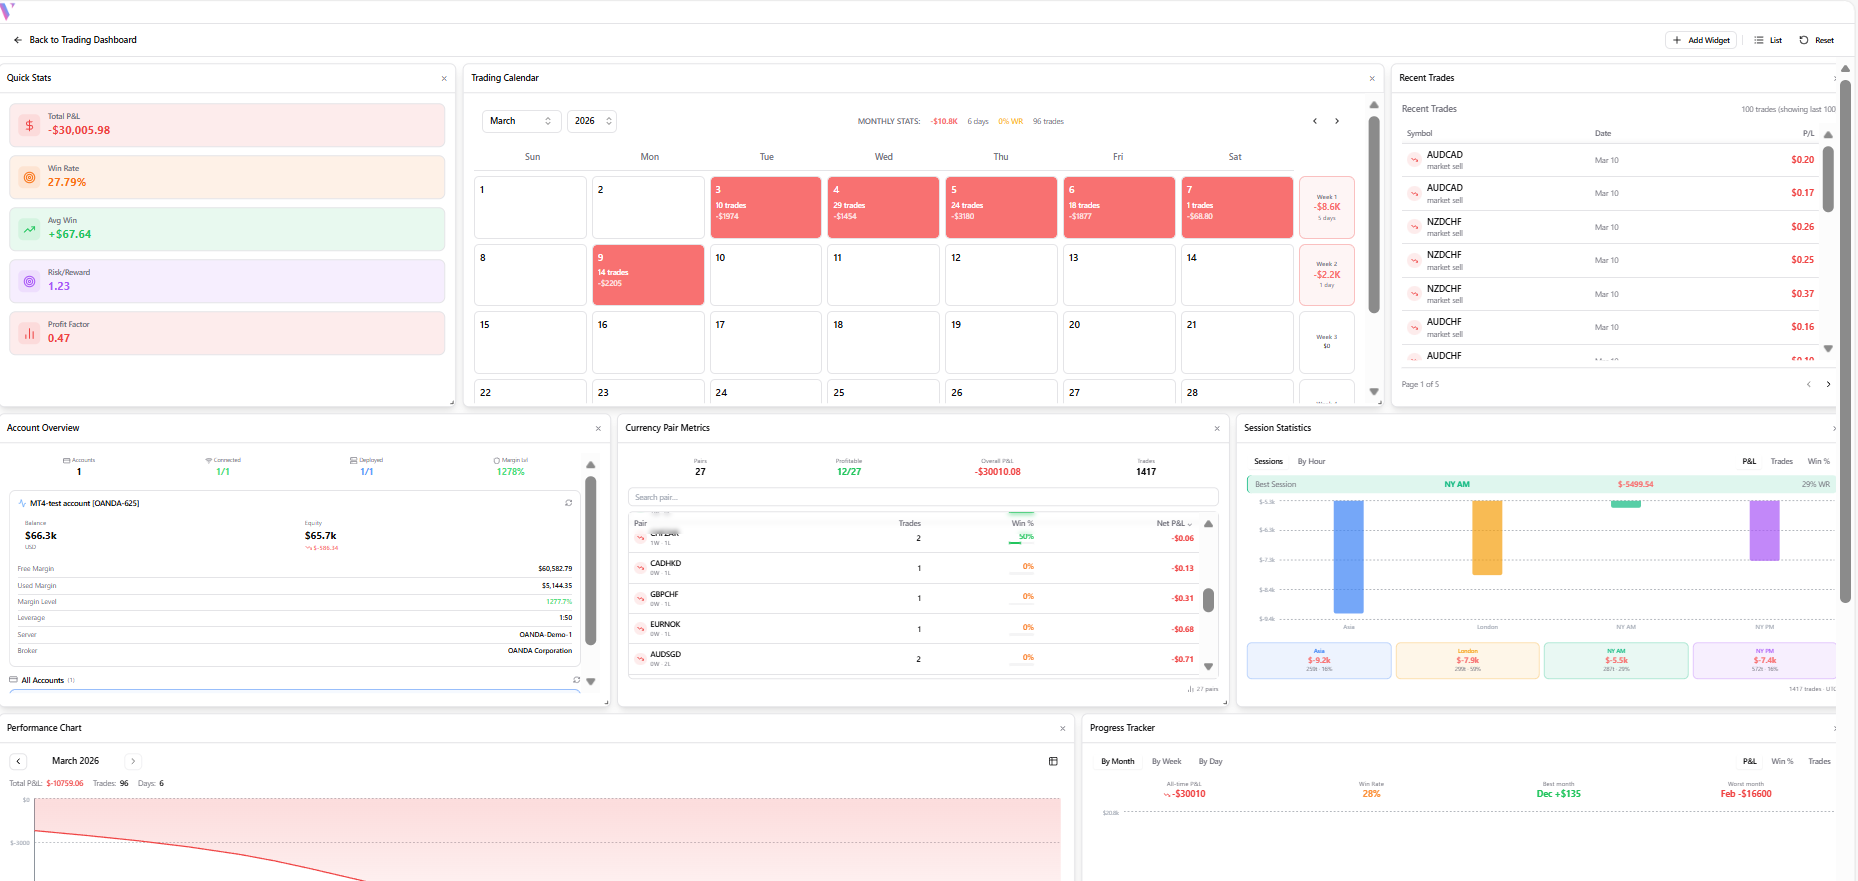
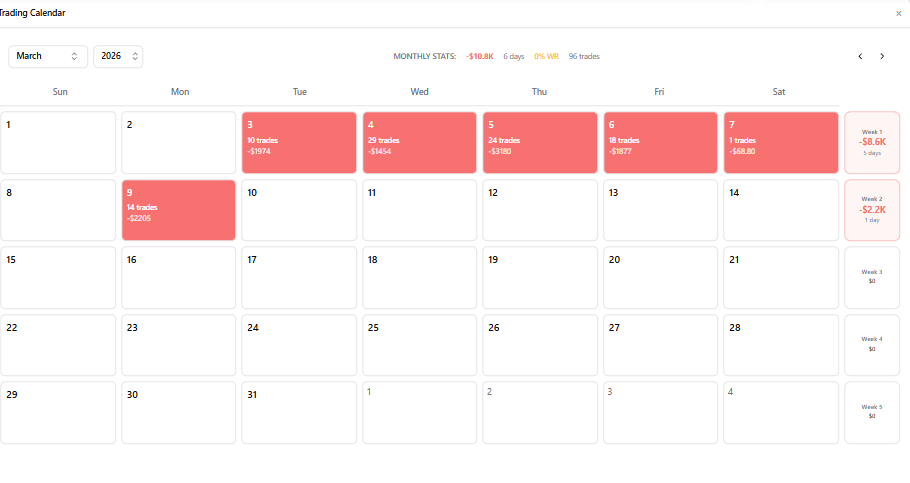
Interactive Calendar
Use the visual calendar to see your trade distribution over time. Click any day to drill down into specific sessions.
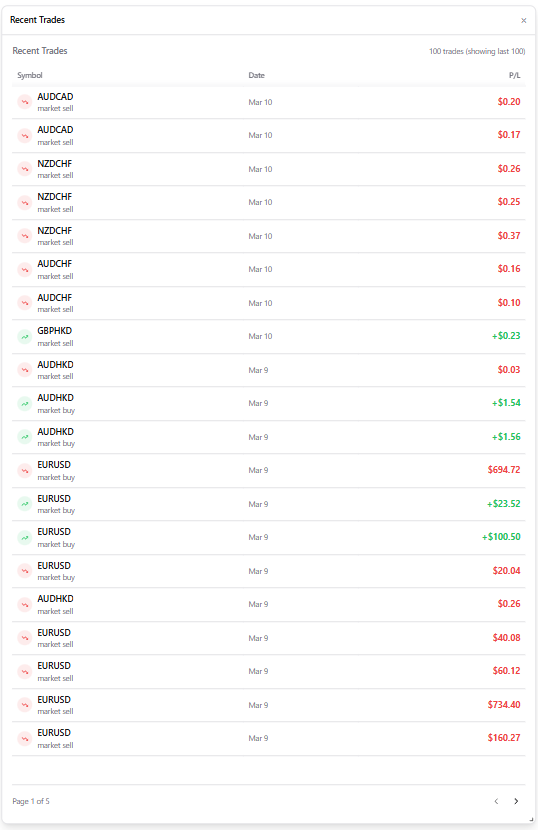
Detailed Trade Log
Review a list of every execution. Filter by asset, date, or outcome to find specific setups for review.
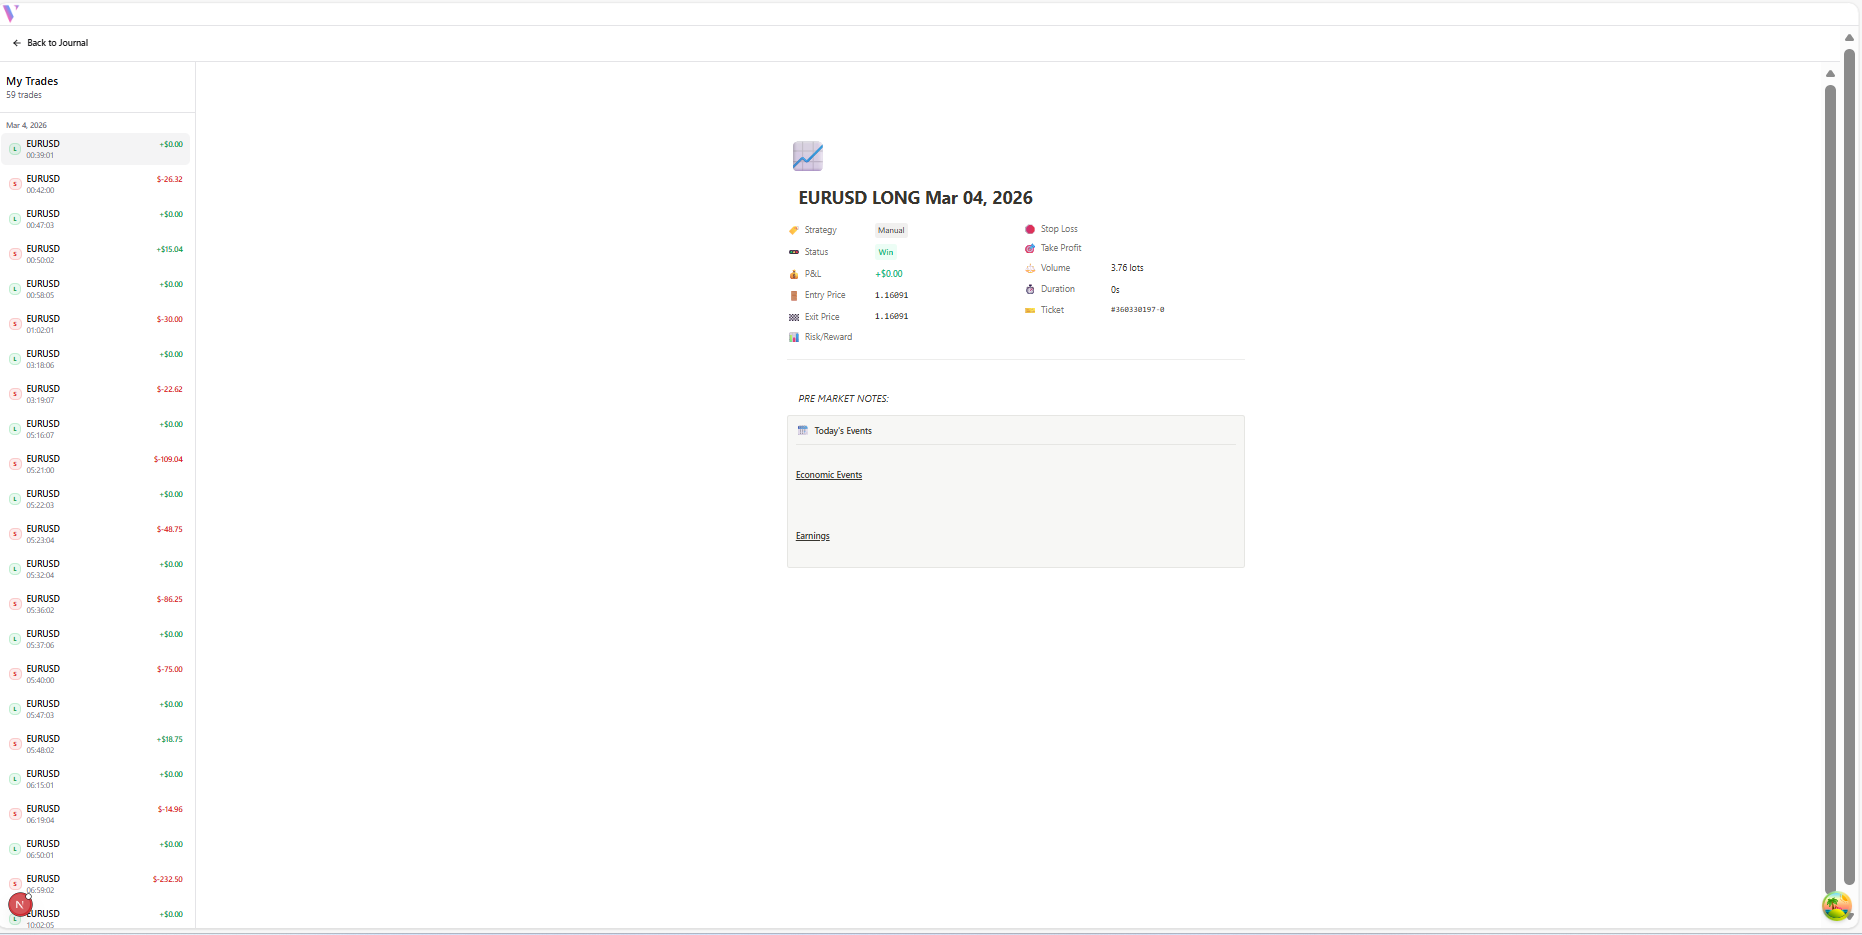
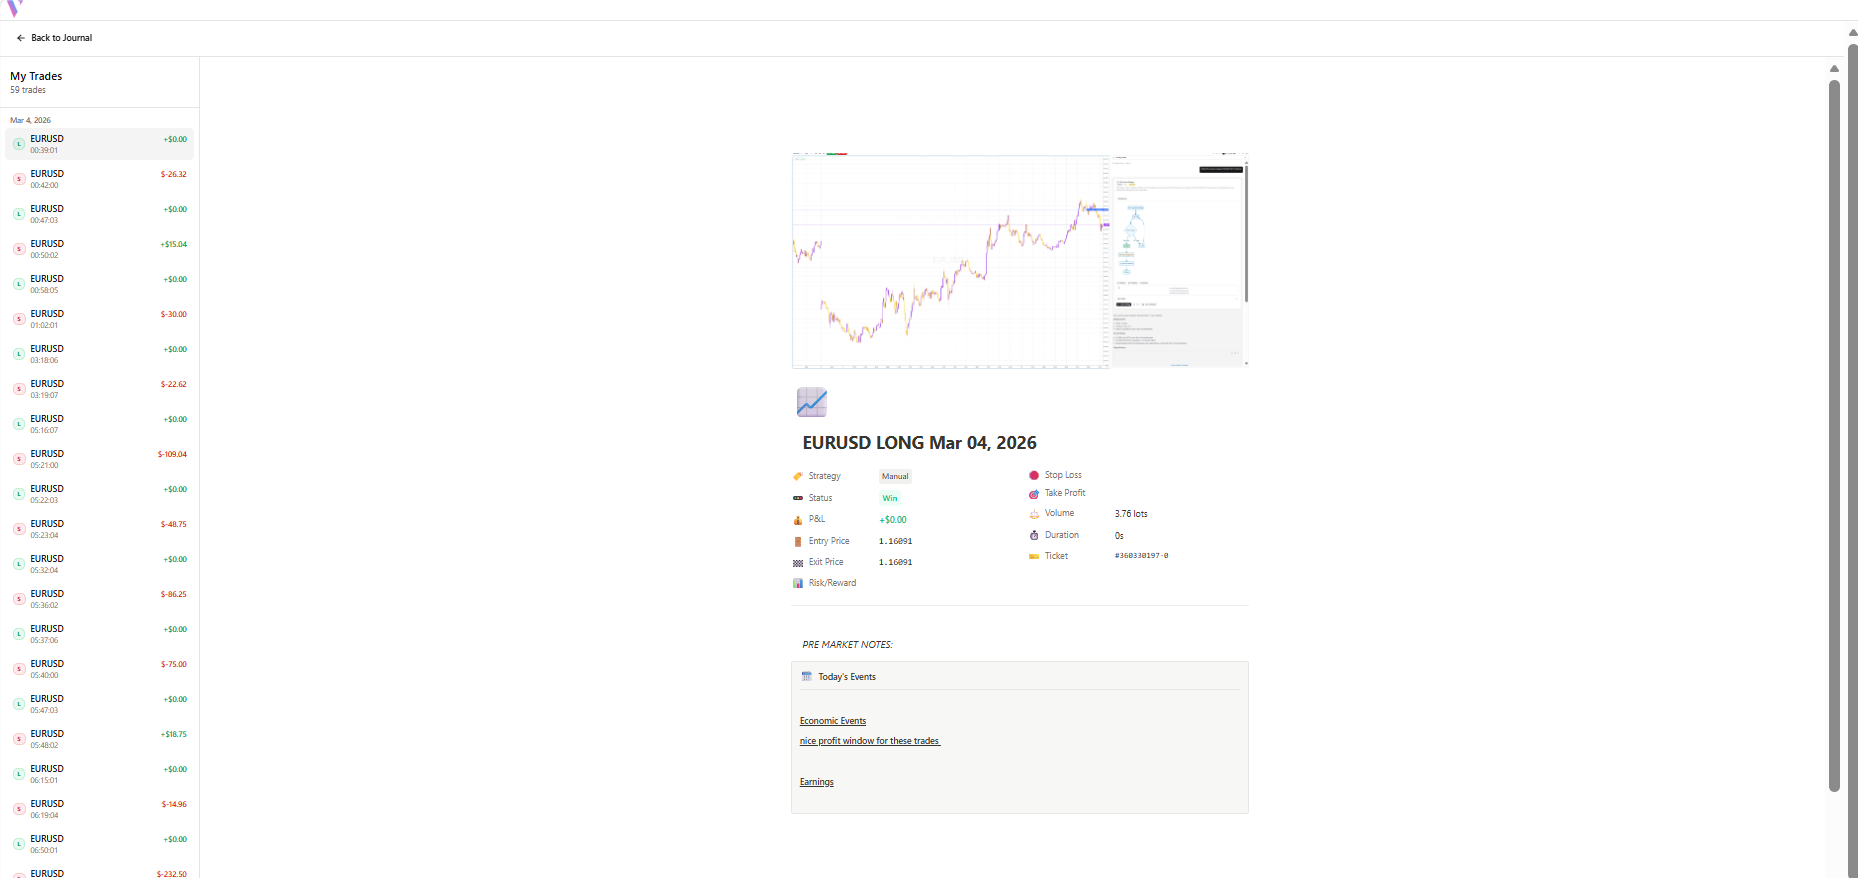
In-Depth Trade Analysis
Click a trade to open its full profile. Analyze entry/exit precision, holding time, and risk-to-reward metrics.
Custom Journaling & Notes
Document your psychology and market context. Use the text editor to add reflections and attach chart screenshots.
Advanced Analytics
Access the Widgets menu to add Session Statistics, Currency Pair Metrics, and Progress Trackers for a deep-dive review.