Skip to Content
Back to Showcase
Interactive Charting
Master our professional-grade charting tools.
Step 1 /
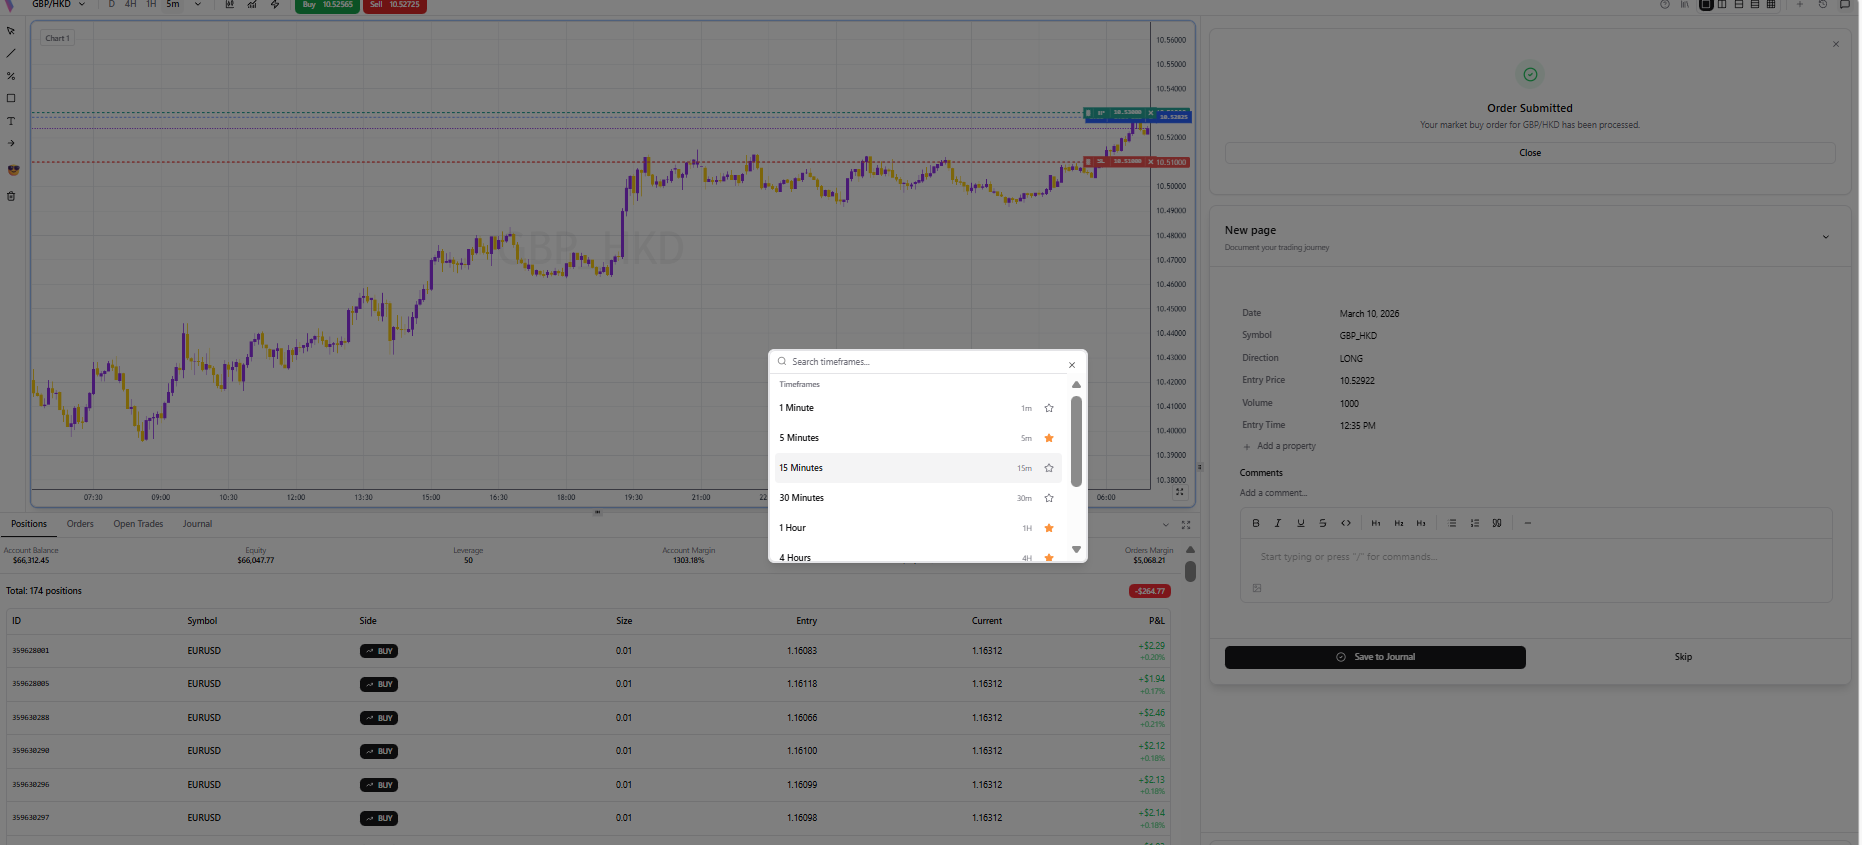
Change Timeframes
Quickly switch between M1, H1, D1, and more using the toolbar.
Step 2 /
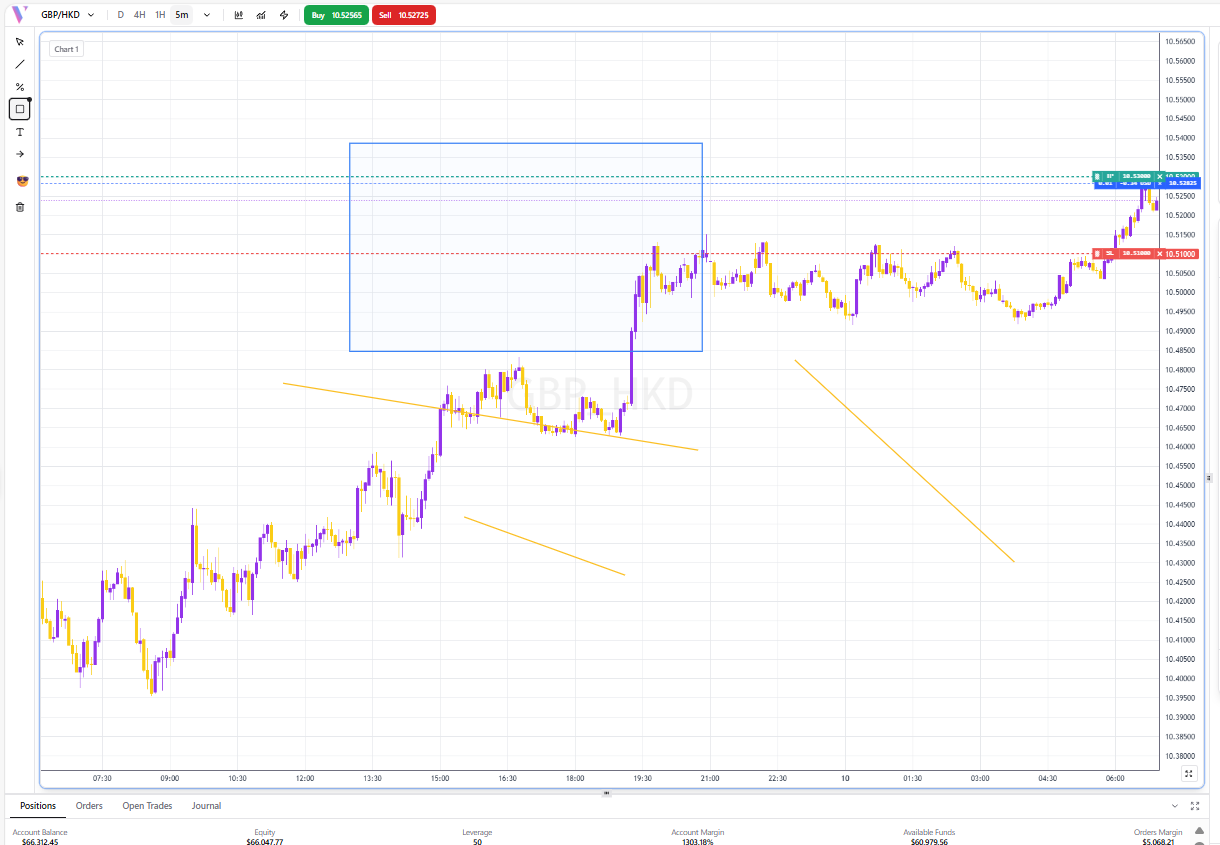
Drawing Tools
Add trendlines, fibonacci levels, and shapes to analyze price action.