Skip to Content
Back to Showcase
Portfolio Analytics
Data-driven insights to refine your edge and manage risk.
Step 1 /
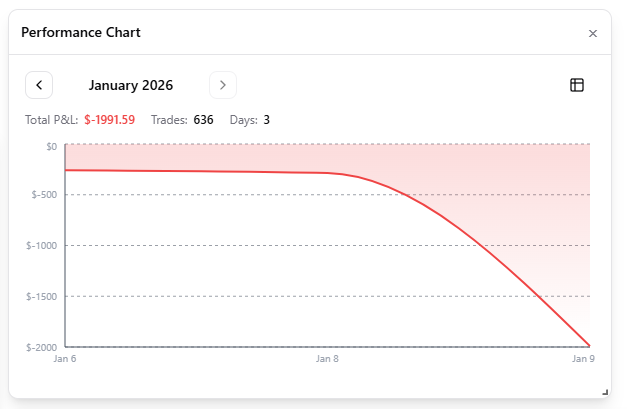
Analyze Equity Curve
Visualize your growth over time with high-fidelity performance charts.
Step 2 /
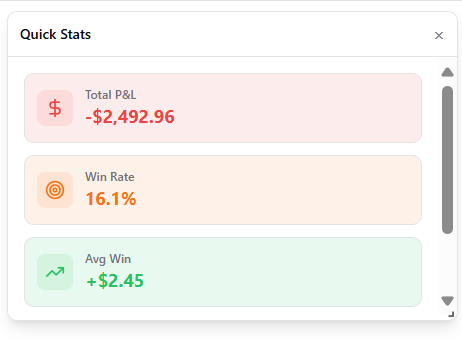
Check Win-Rate & Metrics
Deep-dive into Profit Factor, Maximum Drawdown, and Win Correlation.